Figures & data
Figure 1. Correlation between dopamine (DA) and renalase in HD group (r = 0.28712, p = 0.0098).
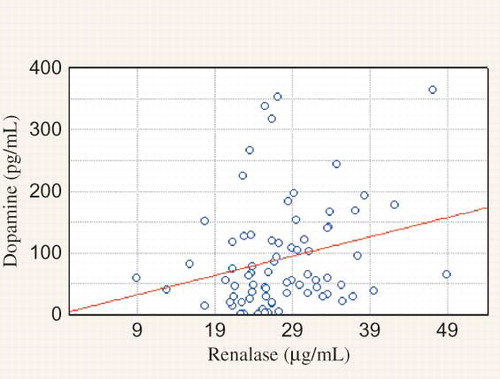
Figure 2. Correlation between residual renal function and dopamine (DA) concentration (r = −0.2035, p = 0.04227).
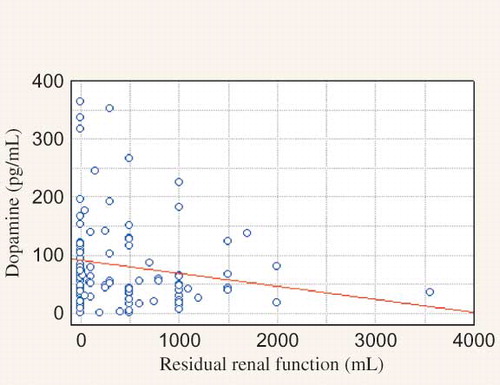
Figure 3. Correlation between renalase and the duration of dialysis (r = 0.3175, p = 0.002).
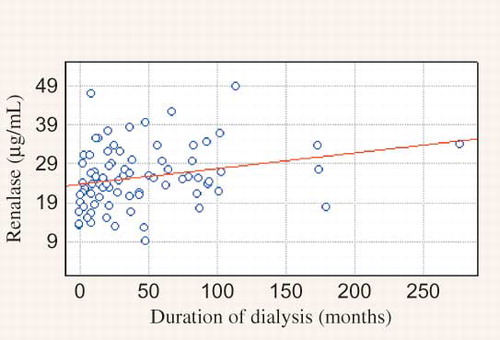
Figure 4. Renalase concentration in regard to residual renal function.
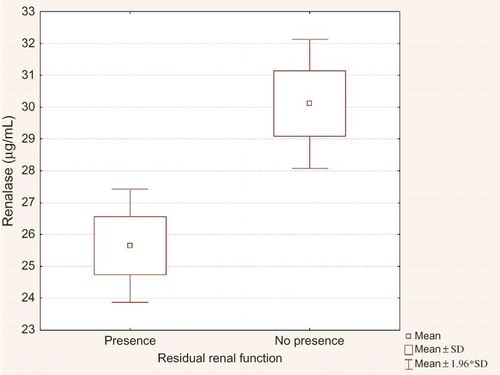
Table 1. Main characteristic of the study cohort.
Table 2. Renalase, norepinephrine (NE), dopamine (DA) concentration in study cohort and control group.
Table 3. Renalase, norepinephrine (NE), and dopamine (DA) concentration in the study groups.