Figures & data
Figure 1. Echocardiographic measurements determined ejection fraction in normal, sham, myocardial infarction (MI), and MI+ losartan (los) rats. (A) Ejection fraction at 3 week (p < 0.001). (B) Ejection fraction at 9 week (p < 0.001). Data are mean ± SD. Notes: ###p < 0.008 versus normal; ***p < 0.008 versus sham; †††p < 0.008 versus MI.
Figure 2. Tail-cuff plethysmograph determined heart rate, systolic blood pressure (SBP) and diastolic blood pressure (DBP) in normal, sham, myocardial infarction (MI), and MI+ losartan (los) rats. (A1) Baseline heart rate (p = 0.180). (A2) Heart rate at 3 week (p = 0.324). (A3) Heart rate at 6 week (p = 0.102). (A4) Heart rate at 9 week (p = 0.943). (B1) Baseline SBP (p = 0.687). (B2) SBP at 3 week (p < 0.001). (B3) SBP at 6 week (p < 0.001). (B4) SBP at 9 week (p < 0.001). (C1) Baseline DBP (p = 0.164). (C2) DBP at 3 week (p < 0.001). (C3) DBP at 6 week (p < 0.001). (C4) DBP at 9 week (p < 0.001). Data are mean ± SD. Notes: ###p < 0.008 versus normal; ***p < 0.008 versus sham; †††p < 0.008 versus MI.
Figure 3. Changes of serum creatinine and blood urea nitrogen (BUN) in normal, sham, myocardial infarction (MI), and MI+ losartan (los) rats. (A1) Serum creatinine 2 days post-MI (p = 0.002). (A2) Serum creatinine at 3 week (p = 0.249). (A3) Serum creatinine at 6 week (p = 0.073). (A4) Serum creatinine at 9 week (p = 0.848). (B1) BUN 2 days post-MI (p < 0.001). (B2) BUN at 3 week (p = 0.004). (B3) BUN at 6 week (p = 0.127). (B4) BUN at 9 week (p = 0.409). Data are mean ± SD. Notes: ###p < 0.008 versus normal; ***p < 0.008 versus sham; †††p < 0.008 versus MI.
Figure 4. Changes of serum cystatin C and 24 h urine protein in normal, sham, myocardial infarction (MI), and MI+ losartan (los) rats. (A1) Serum cystatin C 2 days post-MI (p < 0.001). (A2) Serum cystatin C at 3 week (p < 0.001). (A3) Serum cystatin C at 6 week (p < 0.001). (A4) Serum cystatin C at 9 week (p < 0.001). (B1) Urine protein 2 days post-MI (p = 0.622). (B2) Urine protein at 3 week (p = 0.110). (B3) Urine protein at 6 week (p = 0.443). (B4) Urine protein at 9 week (p = 0.069). Data are mean ± SD. Notes: ###p < 0.008 versus normal; ***p < 0.008 versus sham; †††p < 0.008 versus MI.
Figure 5. Representative inflammatory cell infiltration and tubular necrosis by hematoxylin and eosin (HE) staining (original magnification, ×400) in normal, sham, myocardial infarction (MI), and MI + losartan (los) rats. Inflammatory cells increased significantly in renal cortical tissue, mainly within the tubular interstitium (A3) and surrounding the renal glomerulus (B3) 3 week post-MI heart failure. Further more inflammatory cells were demonstrated 9 week post-MI heart failure (C3, D3). The infiltration of inflammatory cells could be significantly attenuated by the treatment of losartan both at 3 (A4, B4) and 9 week (C4, D4). HE staining suggesting tubular necrosis (arrows) were also revealed in animals with heart failure 3 (E3) and 9 week (F3) post-MI, while losartan treatment significantly prevented tubular necrosis at both time points (E4, F4).
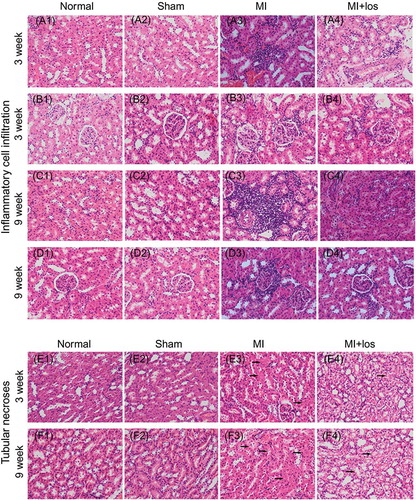
Figure 6. Masson’s trichrome staining (original magnification, ×400) suggesting renal fibrosis (blue staining) in normal, sham, myocardial infarction (MI), and MI + losartan (los) rats. MI induced significantly increase renal fibrosis, including within the tubular interstitium (A3, C3) and glomerulus (B3, D3) at both treatment periods. However, increased renal fibrosis seemed to be attenuated by losartan (B4, C4, and D4).
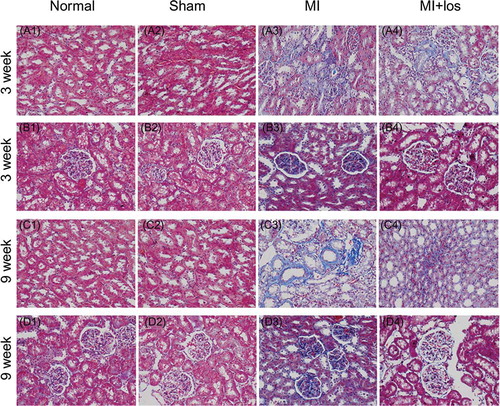
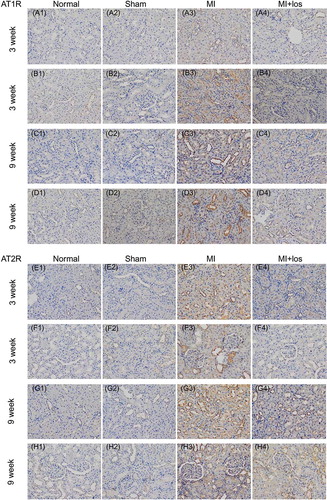
Figure 7. Immunohistochemical staining determined expressions of angiotensin II type 1/2 receptor (AT1R/AT2R) proteins (brown staining) in normal, sham, myocardial infarction (MI), and MI + losartan (los) rats. At both time points, the upregulated expression of AT1R was revealed mainly to locate surrounding the renal glomerulus (B3, D3), which decreased significantly post losartan treatment (B4, D4). However, the upregulated expression of AT2R protein mainly located within the tubular interstitium and surrounding the glomerulus, especially in the renal cortical tissue remote from the glomerulus (E3, G3), and was still high after the treatment of losartan (H4).