Figures & data
Figure 1. Hemin-induced cell death in HK-2 cells. (A) Cytotoxicity effects of different concentrations of hemin (6 h treatment) on HK-2 cells. (B) Time course of cytotoxic effect of 75 μmol/L hemin on HK-2 cells. Each value is expressed as mean ± SD. *p < 0.05, **p < 0.01 compared to vehicle-treated group. (C) Morphological changes of 75 μmol/L hemin treatment for 6 h in HK-2 cells observed with phase contrast microscope (bar = 25 μm).
Figure 2. QPCR analysis of gene expression after hemin treatment. *p < 0.001 compared to control.
Table 1. Genes up-regulated in expression by hemin.
Table 2. Genes down-regulated in expression by hemin.
Figure 3. Expression of ATF3 in HK-2 cells. (A) ATF3 mRNA expression was determined with RT-PCR. Each value is expressed as mean ± SD. *p < 0.001 compared to vehicle-treated group. (B) The localization of ATF3 in hemin-treated and non-treated cells was determined by immuno- cytochemistry with ATF3 antibody (bar = 50 μm). Each value is expressed as mean ± SD. *p < 0.001 compared to vehicle-treated group.
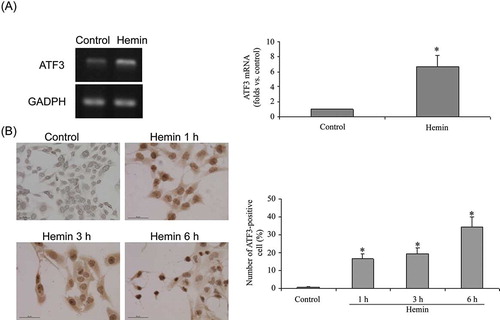
Figure 4. Effects of ATF3-siRNA on hemin toxicity in HK-2 cells. (A) ATF3-siRNA reduced ATF3 gene expression. (B) ATF3-siRNA reduced cell viability after 75 μmol/L hemin treatment for 6 h. (C) ATF3-siRNA augmented caspase-3 activity after 75 μmol/L hemin treatment for 12 h. Each value is expressed as mean ± SD. *p < 0.05 compared to control siRNA-treated group.