Figures & data
Table 1. Comparison of biochemical indicators in each group before contrast media injection ( ± SD, n = 7).
Table 2. Changes of renal function indicators in each group at 48 hrs after contrast media injection ( ± SD, n = 7).
Table 3. Comparison of renal oxidative stress and ATPase parameters after contrast media injection ( ± SD, n = 7).
Figure 1. Representative renal histomorphological changes: (A) NN, normal diet group; (B) HN, high cholesterol diet group; (C) HH, high cholesterol plus contrast media; (D) HM, high cholesterol plus diatrizoate plus MTP131 group; (E) HS: high cholesterol plus diatrizoate plus SPI20 group (HE staining, original magnification ×200).
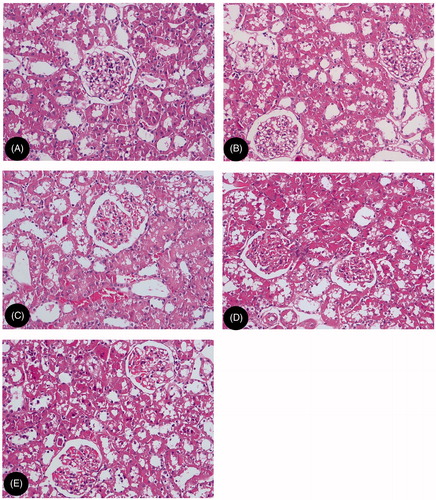
Figure 2. Comparison of tubular injury scores in each group after contrast media injection. Notes: NN, normal diet group; HN, high cholesterol diet group; HH, high cholesterol plus contrast media; HM, high cholesterol plus diatrizoate plus MTP131 group; HS, high cholesterol plus diatrizoate plus SPI20 group. ap < 0.01 versus NN group; bp < 0.01 versus HN group; cp < 0.01 versus HH group.
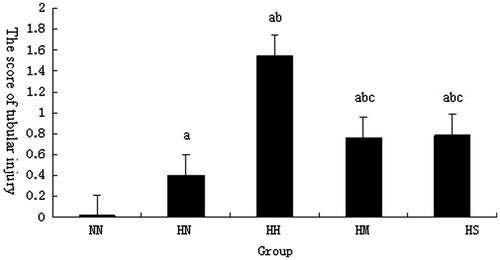
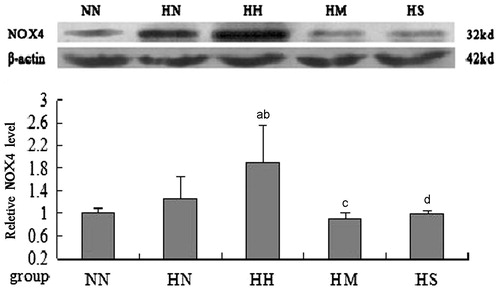
Figure 3. Protein expression of renal tissue NOX4 in each group (Western blotting, n = 3). Notes: NN, normal diet group; HN, high cholesterol diet group; HH, high cholesterol plus contrast media; HM, high cholesterol plus diatrizoate plus MTP131 group; HS: high cholesterol plus diatrizoate plus SPI20 group. ap < 0.05 versus NN group; bp < 0.05 versus HN group; cp < 0.05 versus HH group; dp < 0.01 versus HH group.