Figures & data
Table 1. GFR prediction equations based on serum creatinine level.
Table 2. Clinical and laboratory characteristics of study subjects.
Table 3. Mean measured (iohexol) and estimated glomerular filtration rate values.
Table 4. The bias, random error, precision lower and upper agreement limits and accuracies of the estimation equations.
Figure 1. Iohexol measured and estimated glomerular filtration rate and confidence limits for various formulae (n = 229). Notes: GFR: Glomerular filtration rate, MDRD 1: Modification of Diet in Renal Disease 1 (for six variables), MDRD 2: Modification of Diet in Renal Disease 2 (for four variables), IDMS: Isotope dilution mass spectrometry, CKD - EPI: Chronic Kidney Disease Epidemiology Collaboration. *GFR was expressed as mL/min. **Isotope dilution mass spectrometry traceable creatinine was used.
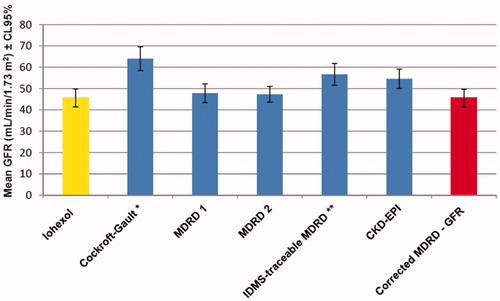
Figure 2. (a) The estimated glomerular filtration rates according to different estimations equations tabulated by iohexol measured glomerular filtration rate values (GFR < 30 mL/min/1.73 m2, n = 97). Notes: GFR: Glomerular filtration rate, MDRD 1: Modification of Diet in Renal Disease 1 (for six variables), MDRD 2: Modification of Diet in Renal Disease 2 (for four variables), IDMS: Isotope dilution mass spectrometry, CKD - EPI: Chronic Kidney Disease Epidemiology Collaboration. *GFR was expressed as mL/min. **Isotope dilution mass spectrometry traceable creatinine was used. (b) The estimated glomerular filtration rates according to different estimations equations tabulated by iohexol measured glomerular filtration rate values (GFR 30 – 60 mL/min/1.73 m2, n = 79). Notes: GFR: Glomerular filtration rate, MDRD 1: Modification of Diet in Renal Disease 1 (for six variables), MDRD 2: Modification of Diet in Renal Disease 2 (for four variables), IDMS: Isotope dilution mass spectrometry, CKD - EPI: Chronic Kidney Disease Epidemiology Collaboration. *GFR was expressed as mL/min. **Isotope dilution mass spectrometry traceable creatinine was used. (c) The estimated glomerular filtration rates according to different estimations equations tabulated by iohexol measured glomerular filtration rate values (GFR > 60 mL/min/1.73 m2, n = 53). Notes: GFR: Glomerular filtration rate, MDRD 1: Modification of Diet in Renal Disease 1 (for six variables), MDRD 2: Modification of Diet in Renal Disease 2 (for four variables), IDMS: Isotope dilution mass spectrometry, CKD - EPI: Chronic Kidney Disease Epidemiology Collaboration. *GFR was expressed as mL/min. **Isotope dilution mass spectrometry traceable creatinine was used.
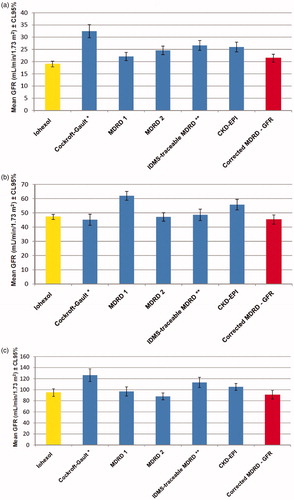
Figure 3. Bland–Altman analysis showing the agreement between iohexol measured glomerular filtration rate and modified MDRD formula (multiplied with the correction coefficient). Notes: GFR: Glomerular filtration rate, MDRD: Modification of Diet in Renal Disease.
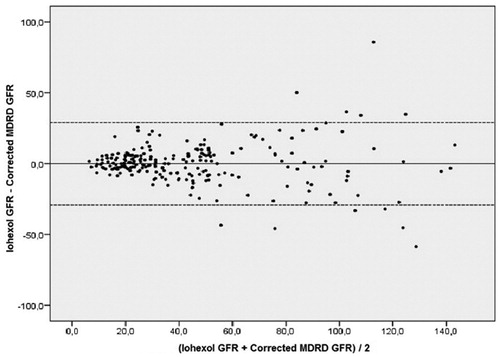
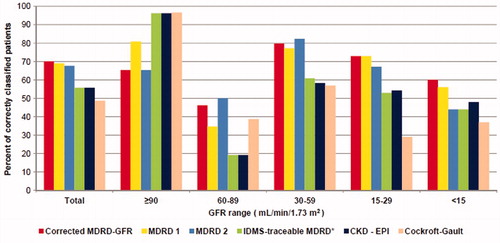
Figure 4. Classification performance of various estimation equations. Notes: GFR: Glomerular filtration rate, MDRD 1: Modification of Diet in Renal Disease 1 (for six variables), MDRD 2: Modification of Diet in Renal Disease 2 (for four variables), IDMS: Isotope dilution mass spectrometry, CKD – EPI: Chronic Kidney Disease Epidemiology Collaboration. *Isotope dilution mass spectrometry traceable creatinine was used.