Figures & data
Figure 1. Cell cycle phases of mesangial cells 24 h after co-culture with 0, 1, 2, 5, and 10 ng/ml TGF-β1 (0 ng/ml serving as control). **stands for p < 0.01 and *p < 0.05 when compared to the control; ‡stands for p < 0.05 when compared to the 1 ng/ml TGF-β1.
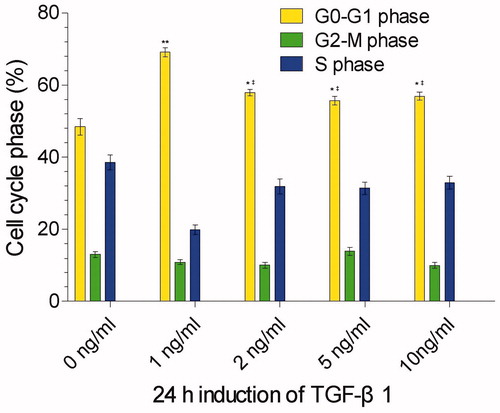
Figure 2. Cell cycle phases of mesangial cells after co-culture with 2 ng/ml TGF-β1 in 0 min (as control), 15 min, 30 min, 60 min, 12 h, 24 h, 48 h, and 72 h. The percentage mesangial cells in G0/G1 phase is continuously increased since 15 min. **stands for p < 0.01 and *p < 0.05 when compared to the control.
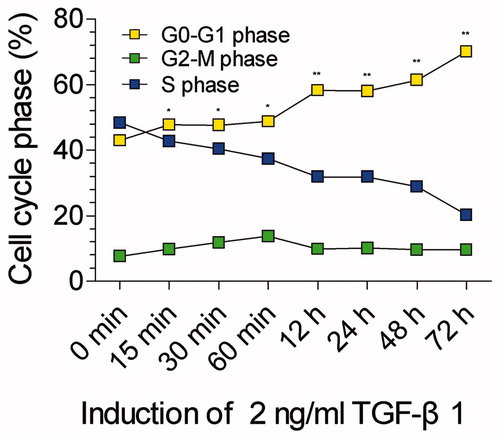
Figure 3. Expression of α-SMA in mesangial cells after TGF-β1 induction. (a) Immunoblotting analysis of α-actin (upper gel) and of α-SMA (lower gel) protein expression 24 h co-culture with different concentrations of TGF-β1 (0, 1, 2, 5, and 10 ng/ml; o as control); (b) Representation of the densitometric intensity band ratio of α-SMA and α-actin that was used as internal control. **stands for p < 0.01.
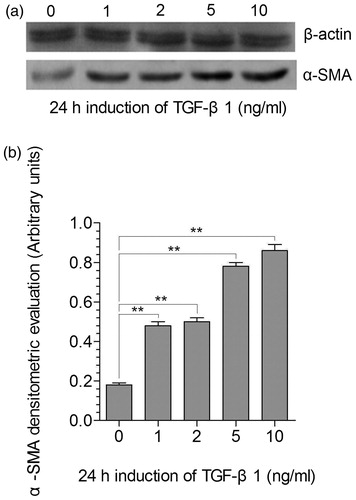
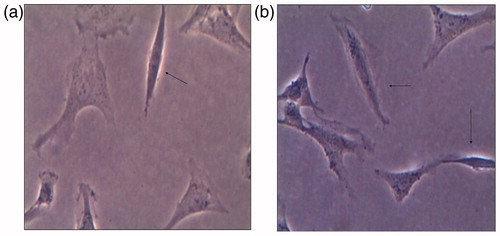
Figure 4. Myofibroblast-like change of mesangial cells after co-culture with 2 ng/ml of TGF-β1. One myofibroblast-transformed cell after 12 h induction of TGF-β1 (a) and several myofibroblast-transformed cells after 24 h induction of TGF-β1 (b) as indicated by using arrows.