Figures & data
Figure 1. Body weight (BW) (A) and systolic blood pressure (SBP) (B) of OLETF HFS, HFS + Hyd, HFS + IR groups and LETO group at 6, 10, 14, 18, 26 weeks of age. OLETF HFS (▴), HFS + IR (×), HFS + Hyd (•), LETO (▪). Values are mean ± SD. *p < 0.05 versus OLETF HFS group.
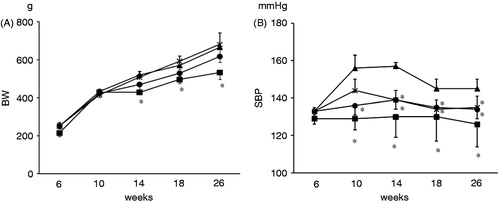
Table 1. Hemoglobin, hematocrit, serum iron and erythropoietin levels at 26 weeks of age.
Figure 2. Histological analysis of iron deposits of the kidney stained by Prussian blue (arrows) (A) and the degree of iron deposits was expressed as a percentage of Prussian blue positive areas per field (B) of OLETF HFS, HFS + IR, HFS + Hyd groups and LETO group at 26 weeks of age. n.s: not statistically significant. Scale bars represent 100 μm. Values are mean ± SD. *p < 0.05 versus OLETF HFS group.
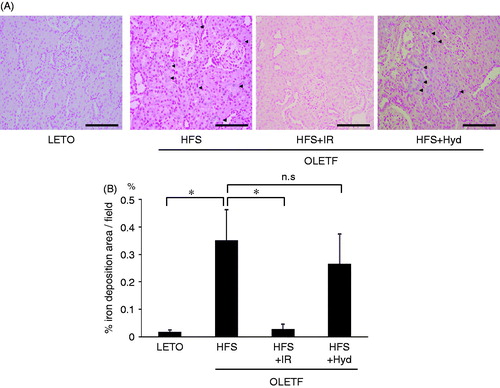
Figure 3. Photomicrographs of renal desmin expression (A) and semiquantitative analysis of immunostaining for desmin (B) of OLETF HFS, HFS + IR, HFS + Hyd groups and LETO group at 26 weeks of age. n.s: not statistically significant. Scale bars represent 100μm. Values are mean ± SD. *p < 0.05 versus OLETF HFS group.
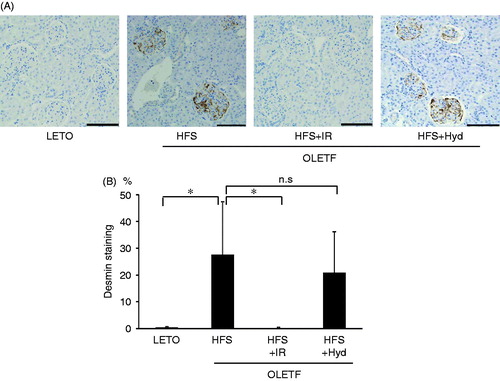
Figure 4. The ratio of urinary protein excretion to urinary creatinine excretion (A) and urinary 8-OHdG excretion (B) of OLETF HFS, HFS + IR, HFS + Hyd groups and LETO group at 26 weeks of age. n.s: not statistically significant. Values are mean ± SD. *p < 0.05 versus OLETF HFS group.
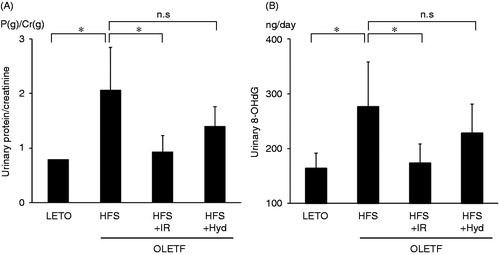
Figure 5. Angiotensinogen mRNA expression by RT-PCR in the kidney of OLETF HFS, HFS + IR, HFS + Hyd groups and LETO group at 26 weeks of age. n.s: not statistically significant. Values are mean ± SD. *p < 0.05 versus OLETF HFS group.
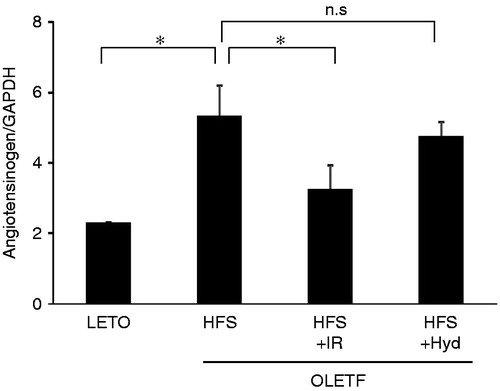
Figure 6. Immunohistochemistry for hypoxia marker pimonidazole of OLETF HFS, HFS + IR, HFS + Hyd groups and LETO group at 26 weeks of age. Scale bars represent 1000 μm (A–D) and 100 μm (E–H) in the renal cortex. The western blot analysis for PIM (I) and the intensity of the bands which are inside the frame of bold line were measured and the quantitative data was normalized by the intensity of β actin (J). PIM: pimonidazole, n.s: not statistically significant. *p < 0.05 versus OLETF HFS group.
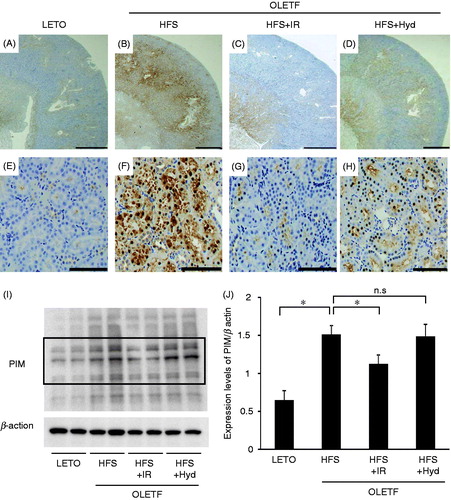
Table 2. Fasting blood glucose and insulin levels at 26 weeks of age.