Figures & data
Table 1. Demograhic and biochemical parameters of ESRD patients and healthy subjects.
Table 2. Demographic features and biochemical values of ESRD patients according to EAT group.
Figure 1. The correlation between EAT and AIP in ESRD patients.
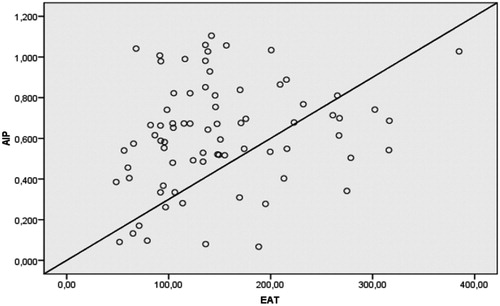
Figure 2. The correlation between EAT and AIP in healthy controls.
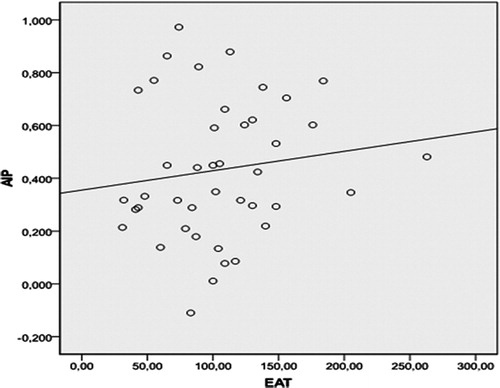
Table 3. Univariate correlation analysis of parameters of ESRD patients related to AIP.
Table 4. The independent predictors of EAT in linear regression analysis.