Figures & data
Table 1. Patient characteristics.
Table 2. ROC AUC analysis for a panel of biomarkers of AKI-risk.
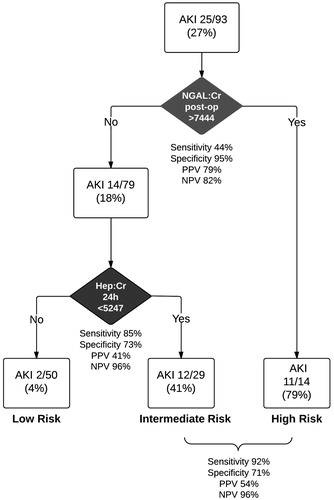
Figure 1. ROC curves for three AKI biomarker combinations with statistically significant increase in AUC. (Panel A) urine π-GST post-op and serum Cystatin-c at 24 h; (Panel B) urine π-GST post-op and urine Hepcidin:Creatinine at 24 h; (Panel C) urine NGAL:Creatinine post-op and urine Hepcidin:Creatinine at 24 h. We considered linear combinations of biomarkers in the form: C = B1 + α × B2 and determined the value of α (range −∞ to +∞) that provided maximal ROC-AUC for the ability of C to predict AKI. Only combinations of structural biomarkers (NGAL, π-GST) and filtered substances (Hepcidin, CysC) demonstrated statistical significance suggesting markers assessing different aspects of the pathophysiology of AKI may have greater combined diagnostic value.
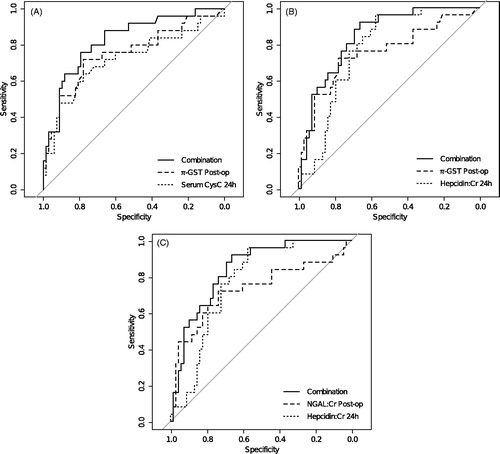
Table 3. Linear combinations of biomarkers and decision tree analysis.
Figure 2. Classification and Regression Tree (CART) analysis for biomarkers in combination. All biomarkers were included but only NGAL:Cr post-op and Hepcidin:Cr at 24 h remained in the final model. Terminal nodes identified high, medium and low risk groups for AKI. This model allows early identification of a high-risk group immediately post-operatively and then a low risk classification at 24 h.