Figures & data
Table 1. Effect of exogenous NaHS, tempol, and a combination of NaHS and tempol on systolic blood pressure (SBP), mean arterial blood pressure (MAP), heart rate (HR), and renal cortical blood perfusion (RCBP) in spontaneously hypertensive rats.
Table 2. Effect of exogenous NaHS, tempol, and a combination of NaHS and tempol on body weight, water intake, food intake, urine flow rate (UFR), plasma H2S, and urinary H2S in spontaneously hypertensive rats.
Figure 1. Oxidant and antioxidant biochemical markers. T-SOD (A), MDA (B), NO (C), and T- AOC (D) of WKY, SHR, SHR + NaHS, SHR + Tempol, and SHR + NaHS + Tempol. The values are mean ± SEM (n = 6). Statistical analysis was done by a repeated measure one-way ANOVA followed by Bonferroni post hoc test. *p < 0.05 versus WKY; †p < 0.05 versus SHR; δp < 0.05 versus SHR + NaHS; #p < 0.05 versus SHR + Tempol. Note: T-SOD, total superoxide dismutase; MDA, malondialdehyde; NO, nitric oxide; T-AOC, total antioxidant capacity.
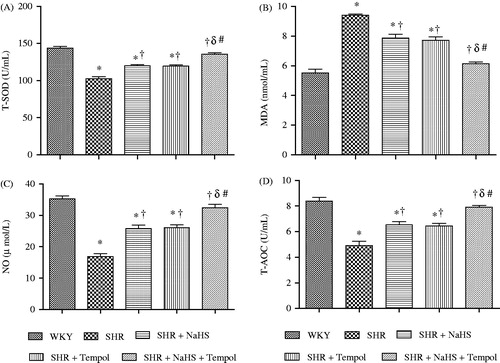
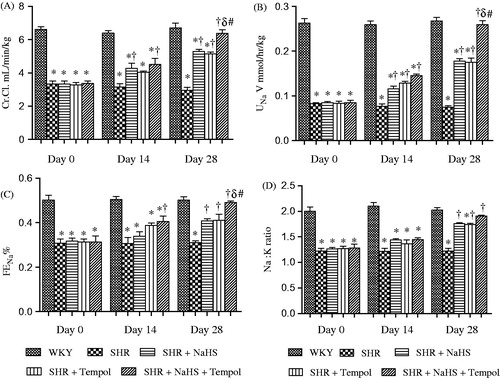
Figure 2. Cr.Cl. (A), UNaV (B), FENa (C), and Na:K (D) of WKY, SHR, SHR + NaHS, SHR + Tempol, and SHR + NaHS + Tempol. The values are mean ± SEM (n = 6). Statistical analysis was done by a repeated measure one-way ANOVA followed by Bonferroni post hoc test in respective days. *p < 0.05 versus WKY; †p < 0.05 versus SHR; δp < 0.05 versus SHR + NaHS; #p < 0.05 versus SHR + Tempol. Note: Cr.Cl., creatinine clearance; UNaV, absolute urinary sodium excretion; FENa, fractional sodium excretion; Na:K, urinary sodium potassium ratio.