Figures & data
Figure 1. The effect of renin–angiotensin II inhibitors on plasma creatinine kinase levels in rats with nephrotoxicity induced by ADR. TOS: Total oxidant status, Cont: Control group, ADR: Adriamycin group, CAP: Captopril group, AL: Aliskren group, CAP + AL: Captopril plus Aliskren group. a: p < 0.05 versus Cont. All data were expressed as mean ± SEM.
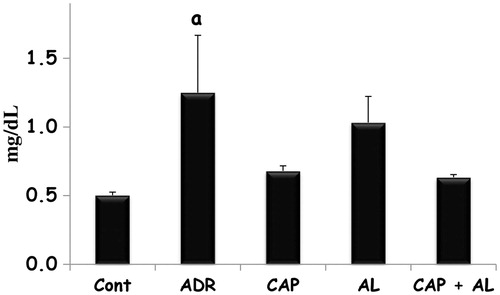
Table 1. The effect of renin–angiotensin II inhibitors on mitochondrial and cytosolic TOS in rats with nephrotoxicity induced by ADR.
Table 2. The effect of renin–angiotensin II inhibitors on mitochondrial and cytosolic TAS in rats with nephrotoxicity induced by ADR.
Figure 2. The effect of renin–angiotensin II inhibitors on mitochondrial membrane potential in rats with nephrotoxicity induced by ADR. MMP: Mitochondrial membrane potential, Cont: Control group, ADR: Adriamycin group, CAP: Captopril group, AL: Aliskren group, CAP + AL: Captopril plus Aliskren group. a: p < 0.05 versus CONT, b: p < 0.001 versus ADR, c: p < 0.01versus CAP + AL. All data were expressed as mean ± SEM.
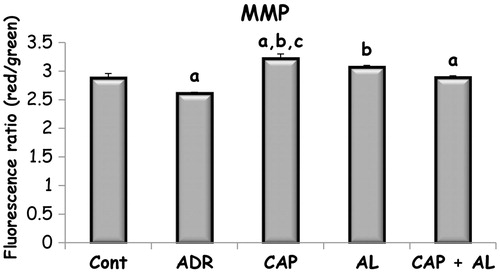
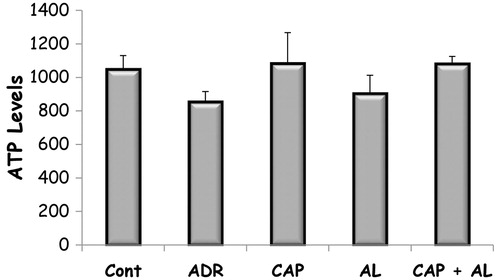
Figure 3. The effect of renin–angiotensin II inhibitors on ATP level in rats with nephrotoxicity induced by ADR. Cont: Control group, ADR: Adriamycin group, CAP: Captopril group, AL: Aliskren group, CAP + AL: Captopril plus Aliskren group. All data were expressed as mean ± SEM.