
Figures & data
Table 1. Effects of GEN alone and its combination with H2S on plasma urea, creatinine, Na, K and 24-h urine volume levels in rats.
Figure 1. (a) Normal tubulus and glomerules in kidney cortex H&E × 100 (control group). (b) Severe tubular necrosis, tubular degeneration and epithelial vacuolization in the proximal tubules ×H&E 100 (GEN-treated group). (c) Moderate tubular necrosis, tubular degeneration and epithelial vacuolization in the proximal tubules H&E × 200 (GEN + vehicle-treated group). (d) Mild epithelial granulovacuolization in the proximal tubules and normal glomerules H&E × 100 (GEN + NaHS-treated group).
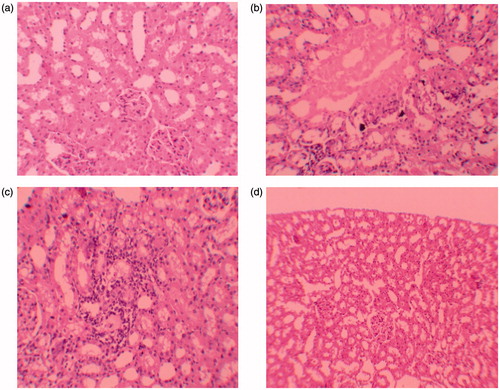
Table 2. Effects of H2S on rat kidney NO, MDA and GSH levels.
Figure 2. (a) Severe mononuclear leukocyte infiltration in the cortex of GEN-treated group. (hematoxylin & eosin, ×400). (b) Leukocyte infiltration was reduced in the NaHS-treated group (hematoxylin & eosin, ×400).
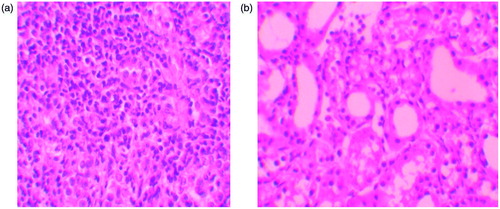
Figure 3. (a) Normal kidney morphology in a control group (masson & trichrome ×200). (b) Severe fibrosis was observed in the peritubular interstitium of the GEN-treated group (masson & trichrome ×400). (c) Mild fibrosis was reduced in the NaHS-treated group (masson & trichrome ×400).
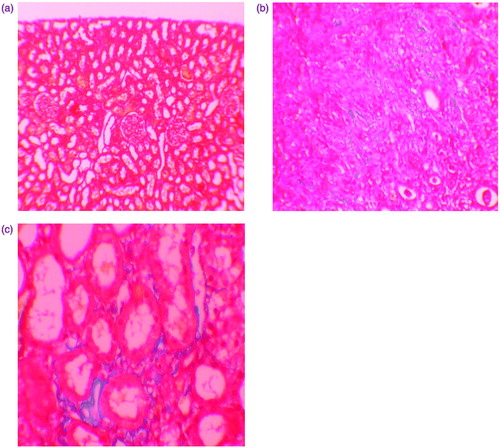
Table 3. Semiquantitative analysis of tubular necrosis, interstitiel fibrosis, leukocte infiltration in control, GEN, GEN + Ve and GEN + NaHS group.