
Figures & data
Figure 1. Kaplan–Meier curve for patient and graft survival.
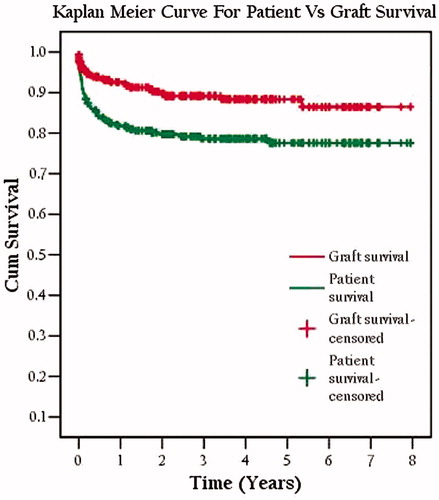
Figure 2 (A) Kaplan–Meier curve for graft survival in subgroups and (B) Kaplan–Meier curve for patient survival in subgroups.
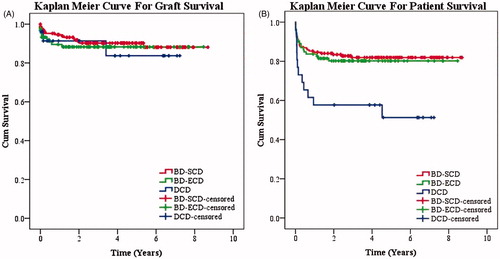
Table 1. Demographic features and clinical outcomes in subgroups.
Table 2. Multivariate analysis.