
Figures & data
Figure 1. Comparison between the groups in terms of immunoexpression percentage.
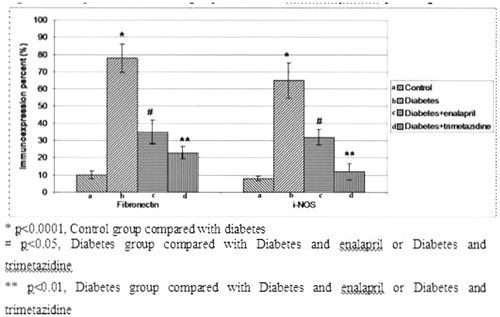
Table 1. Comparison between the groups according to the level of blood sugar, glomerular area (% of control), immunoexpression fibronectin percentage, immunoexpression i-NOS percentage, proteinuria (mg/dL), blood glucose (mg/dL).
Figure 2. H & E staining (×100 magnification): (a) control group (non-diabetes group), (b) diabetes group, (c) diabetes and enalapril, (d) diabetes and trimetazidine.
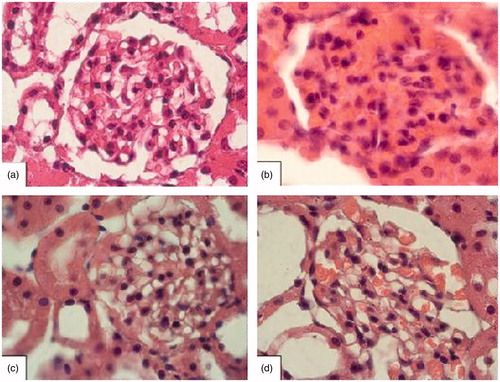
Figure 3. Fibronectin immunostaining (×100 magnification); (a) control group (non-diabetes group), (b) diabetes group, (c) diabetes and enalapril, (d) diabetes and trimetazidine.
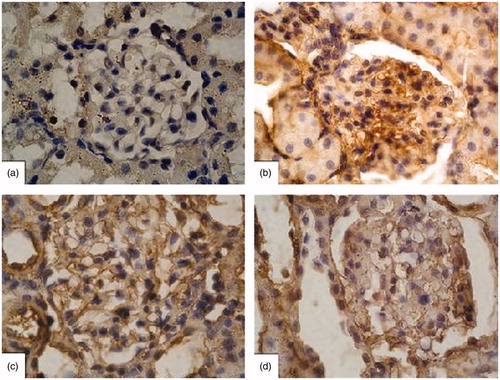
Figure 4. NOS-2 (i-NOS) immunostaining (×100 magnification): (a) control group (non-diabetes group), (b) diabetes group, (c) diabetes and enalapril, (d) diabetes and trimetazidine.
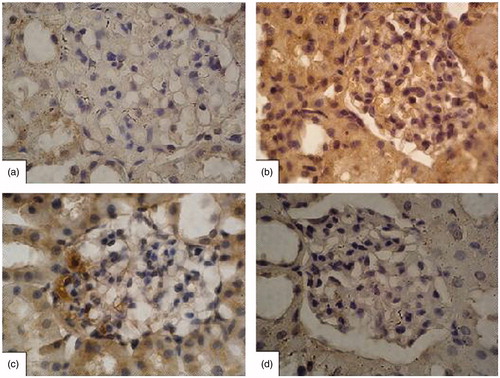
Figure 5. H & E staining (×40 magnification); (a) control group (non-diabetes group), (b) diabetes group, (c) diabetes and enalapril, (d) diabetes and trimetazidine.
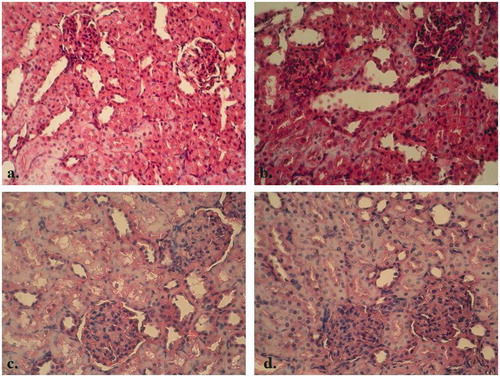
Table 2. Comparison between the groups according to the mean glomerulosclerosis, immunoexpression fibronectin, immunoexpression i-NOS score.