
Figures & data
Table 1. Effects of JTT-751 and calcium carbonate on body weight, amounts of food consumption and parameters (Exp. 1).
Figure 1. Effects of JTT-751, calcium carbonate and combined treatment on urinary, fecal and serum phosphorus in normal rats. (A) Mean urinary phosphorus excretion in 1% JTT-751 group, 1% calcium carbonate group and combined treatment group compared to control group. Data are the mean ± SD. §p < 0.05 versus control group (Bartlett's test followed by Steel's test). (B) Mean fecal phosphorus excretion. (C) Serum phosphorus level at day 8. §p < 0.05, §§p < 0.01 versus control group (Bartlett's test followed by Steel's test).
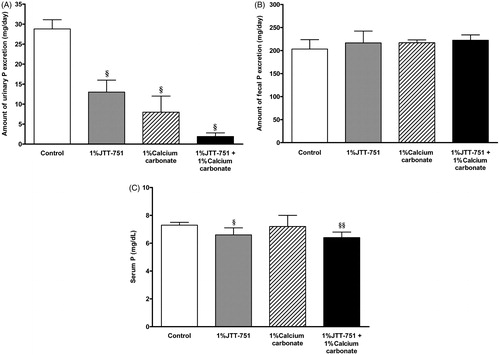
Table 2. Effects of JTT-751 and lanthanum carbonate on body weight, amounts of food consumption and parameters (Exp. 2).
Figure 2. Effects of JTT-751, lanthanum carbonate on urinary, fecal and serum phosphorus in normal rats. (A) Mean urinary phosphorus excretion in lanthanum groups and 2.3% JTT-751 group compared to control group. Data are the mean ± SD. §p < 0.05 versus control group (Bartlett's test followed by Steel's test). (B) Mean fecal phosphorus excretion. †p < 0.05 versus control group (Bartlett's test followed by Dunnett's test). (C) Serum phosphorus level at day 8.
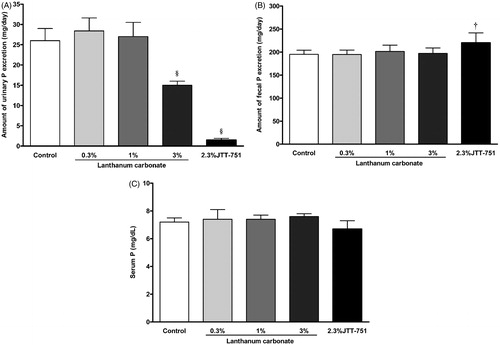
Table 3. The phosphorus absorption-reducing efficacy of JTT-751, lanthanum carbonate and calcium carbonate.