
Figures & data
Figure 1. UCP2 expression in different groups. (a) UCP2 protein expression in western blot analysis. (b) Graphic presentation of relative UCP2 abundance normalized to actin. (c) UCP2 mRNA expression in RT-PCR analysis. (d) Graphic presentation of relative UCP2 mRNA abundance normalized to actin. * p < 0.05 vs. HG; #p < 0.01 vs. HG; △p > 0.05 vs. HG ; **p < 0.01 vs. NG.
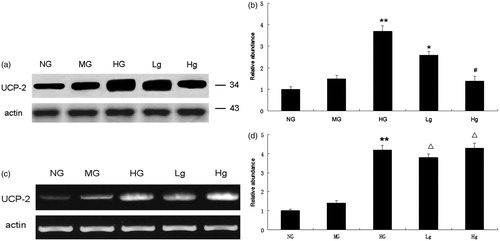
Table 1. MDA levels, SOD, and GPx activities in different groups (mean ± SD).
Figure 2. Downregulation of UCP2 expression in the groups of genipin induced caspase-3 cleavage. CF, cleaved fragments of caspase-3.
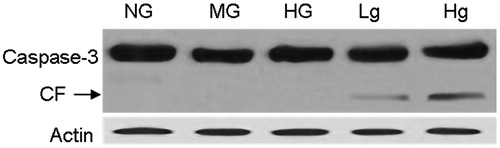
Figure 3. Apoptosis rate. The early apoptotic cells stained by Annexin-V-fluorescein isothiocyanate are located in the lower right quadrant.
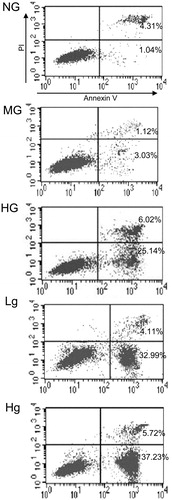
Table 2. Apoptosis rate in different groups (%, mean ± SD).