Figures & data
Figure 1. Pathological changes of marrow biopsy. (A) The initial marrow biopsy (2010), (B) the repeated marrow biopsy (2012). The initial marrow biopsy showed active myelosis and 26% plasmocytes. The myeloma cells were distributed in clusters (). Second time marrow biopsy showed plasmacytes spreading around, but no plasmacytes in clusters ().
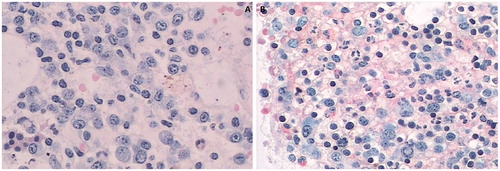
Figure 2. Pathological changes of renal biopsy. (A) Pathological changes of glomerular under bright microscopy (HE, 400×). (B) Immunofluorescent staining of IgA (400×). (C) Pathological changes under electron microscopy (10000×). (D) Kappa chain detected by immunohistochemistry (400×). Mesangial cell hyperplasia, increased matrix, mesangial eosinophilic substance deposition and “false thrombus” in some capillary cavity were observed (). IgA was observed in mesangial area and some capillary loop (). There were large amount of electron dense deposits in expanded mesangial area and under endothelial space. The podocyte foot processes diffusely effaced (). Positive immunoglobulin kappa chain was found in some mesangial area and capillary loop, whose distribution in accord with the eosinophilic substances of H.E. staining, and positive kappa chain was also observed in some renal tubules ().
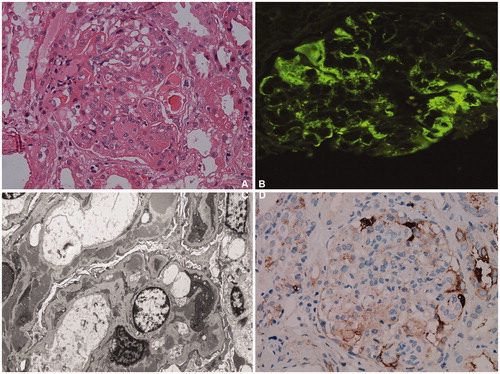
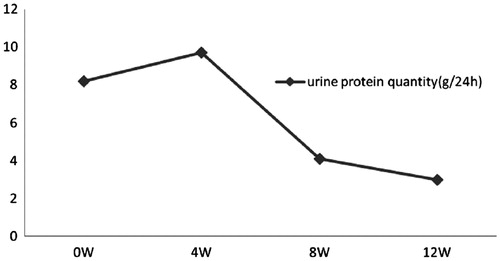
Figure 3. Proteinuria changes in follow-up. The levels of urine protein gradually decreased with the treatment.