Figures & data
Figure 1. Twenty-four hours urinary total protein excretion (A) and blood pressure (B) in WKY and SHR rats. Notes: At 12 weeks of age, the blood pressure and proteinuria of SHR rats was significantly higher than that of WKY rats, ap < 0.01, bp < 0.01 versus age-matched WKY rats.
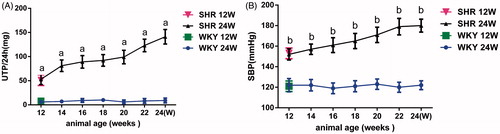
Figure 2. Immunohistochemical staining for CTGF, α-SMA, Collagen-III and PCX in SHR and WKY glomerular. Immunocytochemistry of CTGF (A), α-SMA (B), Collagen-III (C), PCX (D) in kidney.
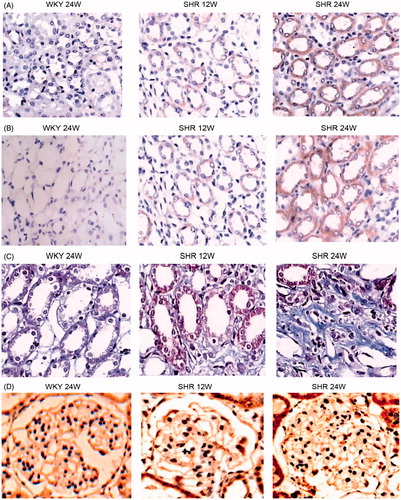
Table 1. OD value of CTGF, PCX, α-SMA and Collagen-III in SHR and WKY rats ().
Figure 3. Indirect immunofluorescence of mouse renal cortex cryostat sections. Notes: The photomicrographs are developed to the same intensity of signal. ×400. (A) WKY 24W; (B) SHR 12W; (C) SHR 24W.
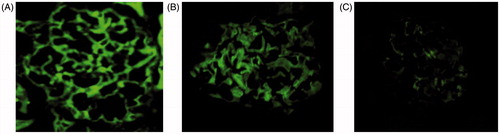
Figure 4. The alteration of renal structure. Note: PAS × 400. (A) WKY 24W, (B) SHR 12W, (C) SHR 24W.
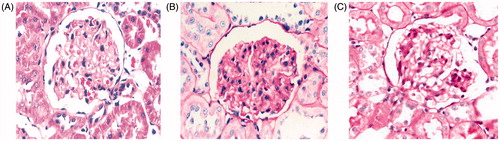
Figure 5. Tubular and interstitial lesions in kidney using Masson’s trichrome stain. Note: ×400 (A) WKY 24W, (B) SHR 12W, (C) SHR 24W.
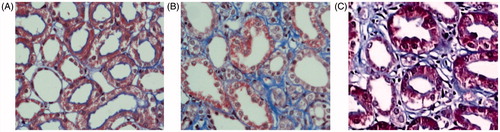
Figure 6. Ultrastructure analysis of podocytes. Notes: Electron microscopy×10,000 Podocyte foot processes were already effaced in some glomeruli in SHR rats. (A) WKY 24W, (B) SHR 12W, (C) SHR 24W.
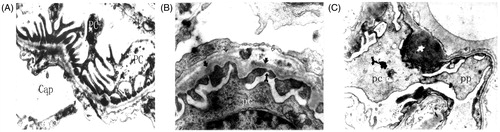
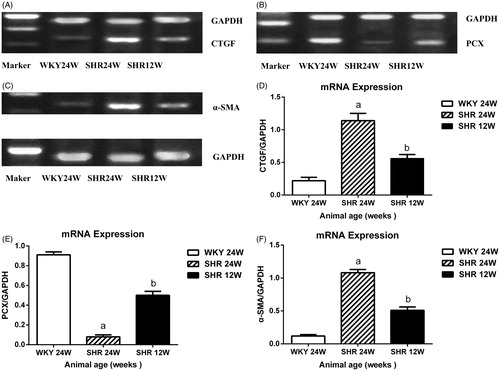
Figure 7. Genes expression in the glomeruli. Notes: RT-PCR analysis of the CTGF (A) PCX (B) α-SMA (C) Quantitative analysis of CTGF (D) and PCX (E) and α-SMA (F) ap < 0.01, bp < 0.01.