
Figures & data
Figure 1. (a–h) Especially, a calculus that shows the stages in processing some of the parameters that are statistically significant in the ImageJ programme (a) original axial CT image, (b) the cut zone from the image, (c) the black-white image after running threshold command, (d) determination of the border of object, (e) drawing of an ellipse best fit to the border of object, (f) Feret diameter of object, (g) measuring the angle, (h) measuring the Feret angle.
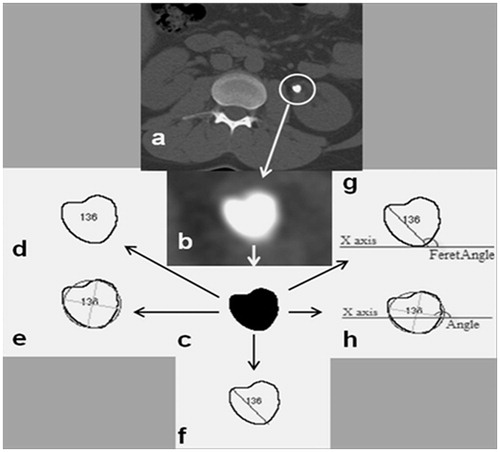
Table 1. The morphological characteristics of calculi or calcification evaluated by ImageJ.
Table 2. The mean value (±2 SD) for all variables at groups of renal, ureter and other turbidities.
Figure 2. Combined ROC curve graphs of parameters that have statistically significant characteristics.
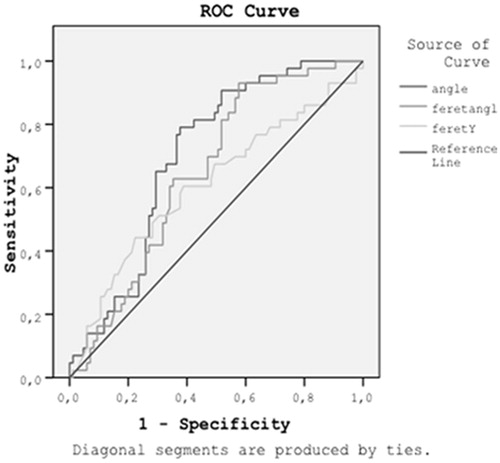
Table 3. The comparison of mean parametric values of calculous and non-calculous turbidities.
Figure 3. ROC curve and the statistical data related to angle ((a) under the non-parametric assumption and (b) null hypothesis: valid area = 0.5).
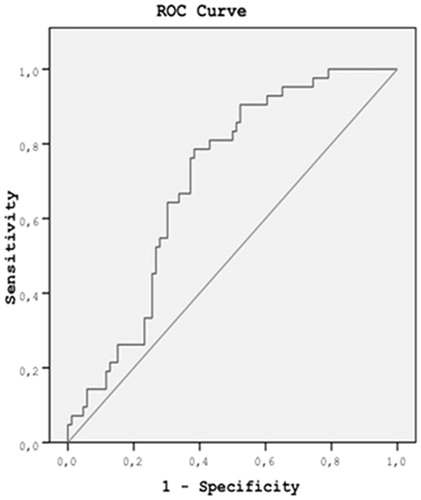
Figure 4. ROC curve and the statistical data related to feret angle. There is a correlation between the positive actual state group and the negative actual state group at Feret angle. Statistics may be biased. ((a) Under the non-parametric assumption and (b) null hypothesis: valid area = 0.5).
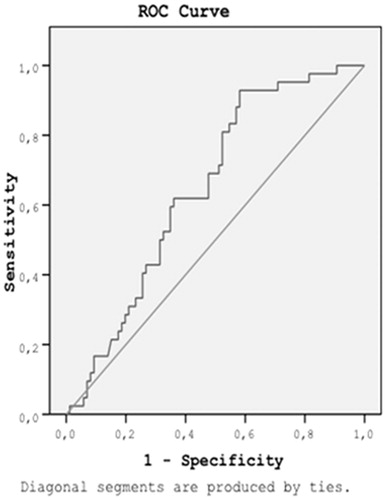
Table 4. The difference between renal and ureteric calculi variables in the equation.