Figures & data
Table 1. Unit costs of interventions. Interventional radiology and operative costs include all consumables and staffing but not bed days.
Figure 1. Decision tree reflecting all interventions for the two year follow-up period. Probabilities of each pathway are highlighted in brackets after each node.
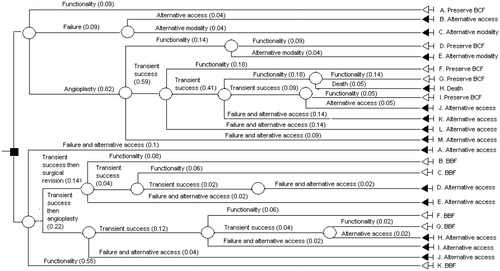
Table 2. Comparison of CAS angioplasty and BBF creation.
Figure 2. Proportion of patients in every state of the decision tree model at various time points for CAS angioplasty (top) and new BBF creation (bottom).
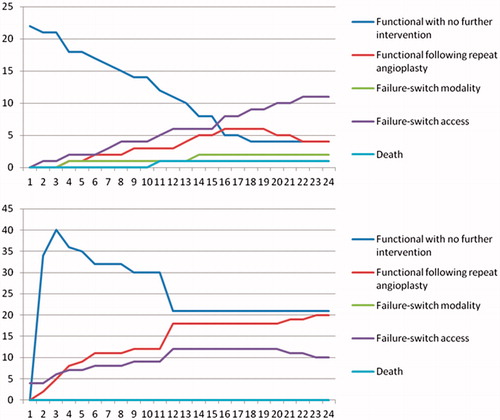
Table 3. Probabilities and costs of scenarios in decision tree.
Figure 3. Monte Carlo simulation (bootstrap method) of the cost-effectiveness plane for new BBF creation in patients with CAS. The x-axis indicates the difference in QALYs with de novo BBF creation compared to CAS angioplasty, while the y-axis indicates the difference in costs over a two year period for BBF compared to CAS angioplasty. Each point represents a possible outcome given the uncertainty. A point in the upper right quadrant indicates in favor of BBF (with BBF having better QALY at a lower cost than angioplasty); a point in the lower left quadrant indicates in favor of angioplasty (with BBF having worse patency at a higher cost than angioplasty) and both upper left and lower right indicate a trade-off (with worse patency at lower cost or better patency at higher cost).
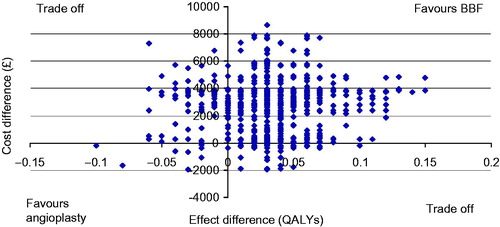
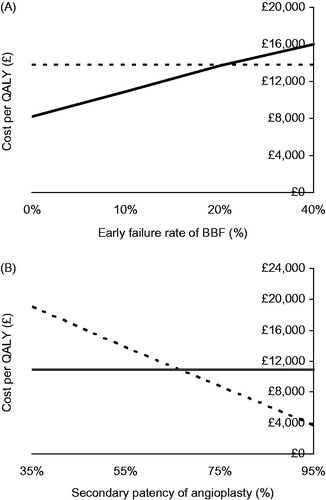
Figure 4. Sensitivity analysis. (A) Cost/QALY with increasing early failure rate of BBF. (B) Cost/QALY with increasing success rate of angioplasty (restoring secondary patency).