Figures & data
Figure 1. Effects of Picroside II modification on renal function. (A) Effects of Picroside II on the serum BUN concentrations after 45 min of ischemia followed by 12 weeks of reperfusion. (B) Effects of Picroside II on the serum Cr concentrations after 45 min of ischemia followed by 12 weeks of reperfusion (means ± SEM).
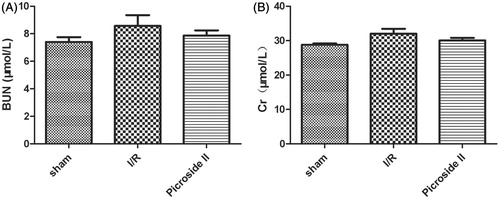
Figure 2. Picroside II attenuated tissue damage, fibrogenic development and α-SMA expression during I/R. (A, D, G) section from sham-operated rat, (B, E, H) section from rat subjected to I/R, (C, F, I) section from rat subjected to the treatment with Picroside II. (A–C) H&E staining. (D–F) Sirius red staining. (G–I) α-SMA immunohistochemical staining. All H&E, Sirius red and immunohistochemical staining, original magnification ×200.
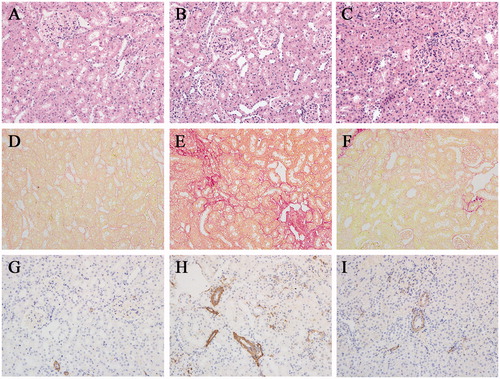
Figure 3. Quantification of Sirius red–positive area and α-SMA–positive cells in different groups. (A) Quantification of Sirius red– positive area. (B) Quantification of α-SMA-positive cells (means ± SEM; *p < 0.05 versus sham; # p < 0.05 versus I/R).
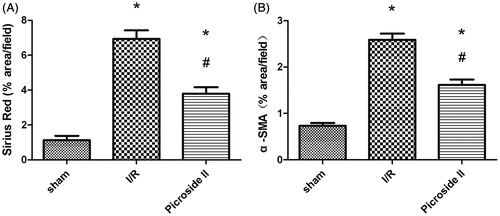
Figure 4. The mRNA level of TNF-α, IL-1β, IL-10 and HO-1 in the kidney. (A) Effects of Picroside II on the mRNA level of TNF-α after 45 min of ischemia followed by 12 weeks of reperfusion. (B) Effects of Picroside II on the mRNA level of IL-1β after 45 min of ischemia followed by 12 weeks of reperfusion. (C) Effects of Picroside II on the mRNA level of IL-10 after 45 min of ischemia followed by 12 weeks of reperfusion. (D) Effects of Picroside II on the mRNA level of HO-1 after 45 min of ischemia followed by 12 weeks of reperfusion. mRNA was standardized for β-actin mRNA (means ± SEM; *p < 0.05 versus sham; # p < 0.05 versus I/R).
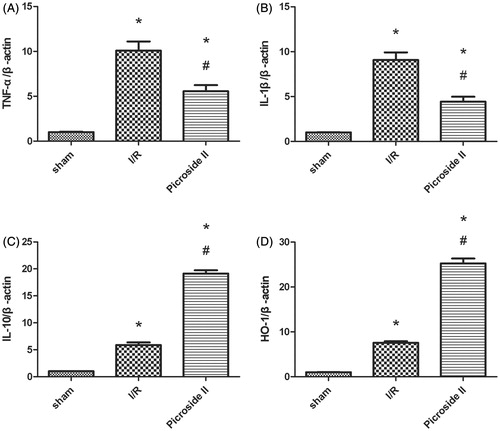
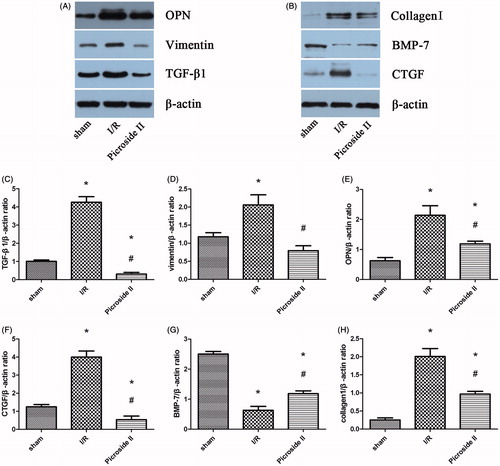
Figure 5. Representative Western blots showed the effects of Picroside II on TGF-β1, OPN, vimentin, collagen I, CTGF and BMP-7 expression in the kidney after 45 min of ischemia followed by 12 weeks of reperfusion. (A) Representative Western blots showing the effects of Picroside II on TGF-β1, OPN, and collagen I expression. (B) Representative Western blots showing the effects of Picroside II on vimentin, CTGF, and BMP-7 expression. (C) Relative band densities of TGF-β1 to the mean value of the control. (D) Relative band densities of vimentin to the mean value of the control. (E) Relative band densities of OPN to the mean value of the control. (F) Relative band densities of CTGF to the mean value of the control. (G) Relative band densities of BMP-7 to the mean value of the control. (H) Relative band densities of collagen I to the mean value of the control (means ± SEM; *p < 0.05 versus sham; #p < 0.05 versus I/R).