Figures & data
Figure 1. Effect of ozone OP on apoptosis of NRK-52E cells subjected to H/R injury. The apoptosis was examined using annexin V-FITC/PI staining and flow cytometry analysis. The experiment was repeated three times and representative data are shown.
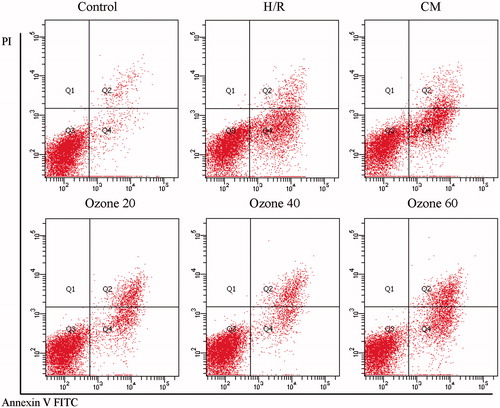
Figure 2. Staining with Hoechst 33258 and immunocytochemistry. (A and D) cells from control group, (B and E) cells from H/R group, (C and F) cells from ozone 40 preconditioning group. (A–C) Hoechst 33258 staining. (D–F) cleaved caspase-3 immunohistochemical staining. All Hoechst 33258 and immunohistochemical staining, original magnification ×200.
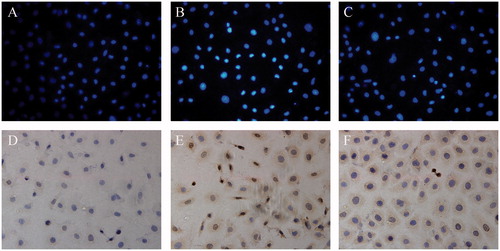
Figure 3. (A) Assay of SOD activity in NRK-52E cells of different groups. (B) Assay of MDA content in NRK-52E cells of different groups. (C) Assay of LDH leaking ratio in NRK-52E cells of different groups. Bars represent means ± SEM (n = 4); *p < 0.05 versus Group C, #p < 0.05 versus Group H/R.
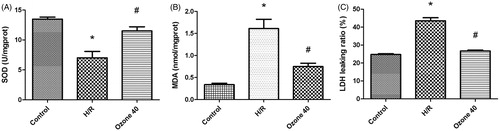
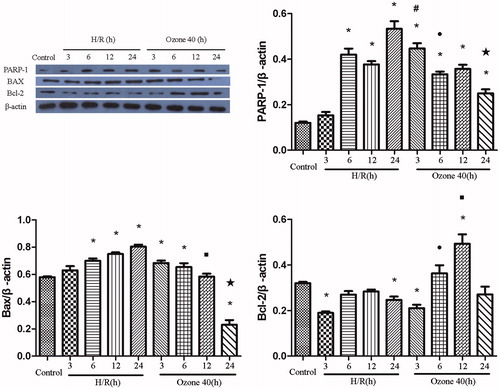
Figure 4. Representative Western blots showed the effects of ozone on PARP-1, Bcl-2 and Bax expression in NRK-52E cells of different groups. (A) Representative Western blots showing the effects of ozone preconditioning on PARP-1, Bcl-2 and Bax expression. (B) Relative band densities of PARP-1 to the mean value of the control. (C) Relative band densities of Bcl-2 to the mean value of the control. (D) Relative band densities of Bax to the mean value of the control (means ± SEM; *p < 0.05 vs. Group C; #p < 0.05 vs. Group H/R 3 h; •p < 0.05 vs. Group H/R 6 h; ▪p < 0.05 vs. Group H/R 12 h; ★p < 0.05 vs. Group H/R 24 h).