Figures & data
Figure 1. Selection process of references for the meta-analysis.
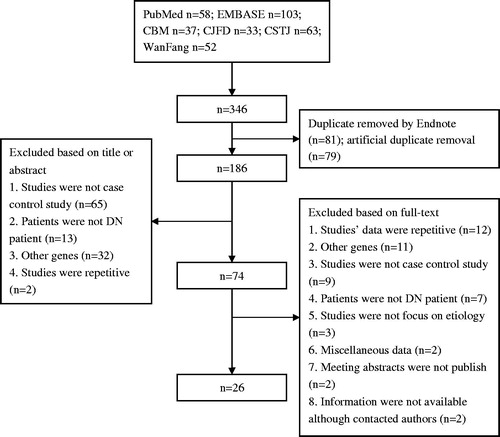
Table 1. Characteristics of the studies included in the meta-analysis.
Table 2. Distribution of NOS3 genotypes and p values in χ2 test of HWE in the eligible studies.
Table 3. Quality indicators from Newcastle-Ottawa scale (NOs).
Table 4. Random effects odds ratios and heterogeneity results for the association of eNOS 4b/a gene polymorphisms and DN.
Figure 2. Meta-analysis for eNOS 4b/a polymorphism in DN (pre-allele model: 4a vs. 4b) compared with DM patients.
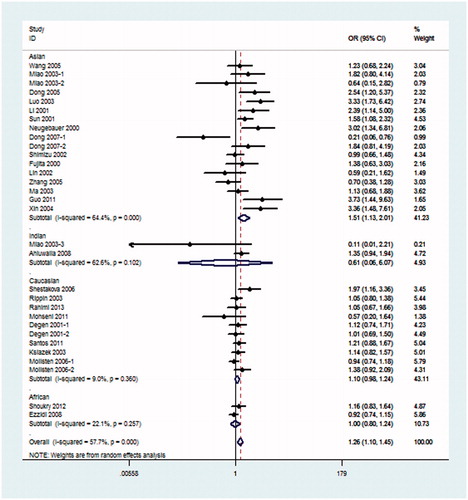
Figure 3. Meta-analysis for eNOS 4b/a polymorphism in DN (dominant model: 4aa + 4ab vs. 4bb) compared with DM patients.
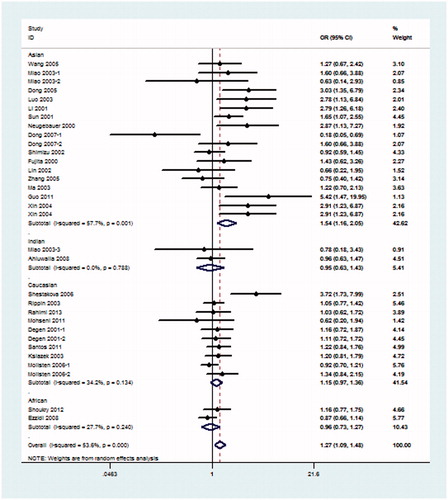
Figure 4. Meta-analysis for eNOS 4b/a polymorphism in DN (recessive model: 4aa vs. 4bb + 4ab) compared with DM patients.
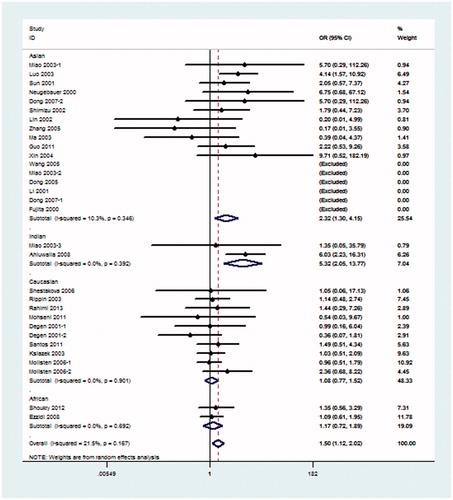
Figure 5. Meta-analysis for eNOS 4b/a polymorphism in DN (additive model: 4aa vs. 4bb) compared with DM patients.
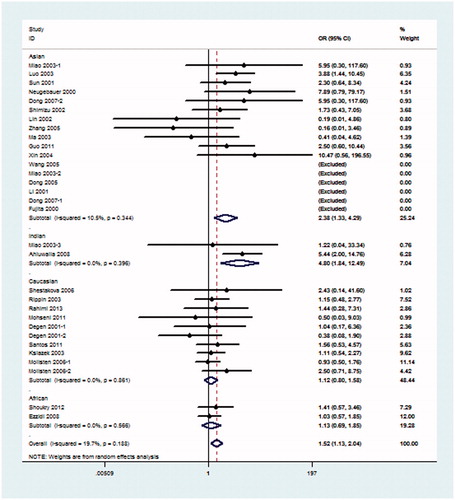
Figure 6. Meta-analysis for eNOS 4b/a polymorphism in DN (co-dominant model: 4ab vs. 4aa + 4bb) compared with DM patients.
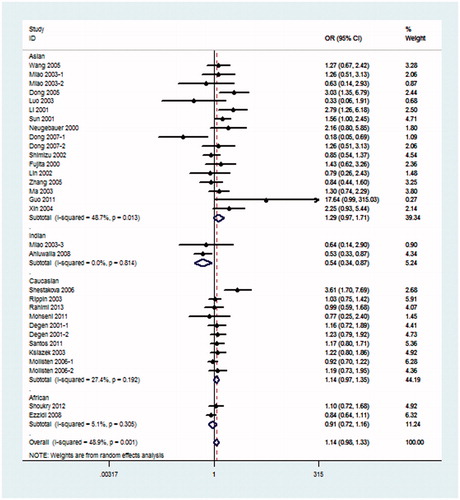
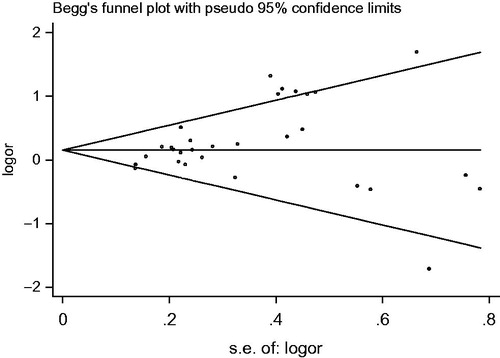
Figure 7. Funnel plot for articles associated with eNOS polymorphism and DN compared with DM patient under dominant model.