Figures & data
Table 1. Effect of atherogenic diet and treatment with TRF on the levels of plasma lipids in rats.
Table 2. Effect of atherogenic diet and treatment with TRF on lipid peroxidation and LDL oxidation in rats.
Table 3. Effect of atherogenic diet and treatment with TRF on the levels of serum nitric oxide in rats.
Figure 1. Microscopic graphs showing the atherosclerosis of coronary artery. Sections stained with Oil-Red-O and hematoxylin, 40×. (A) Rats fed with normal rat chow; (B) rats given atherogenic diet; and (C) atherogenic rats treated with TRF for six weeks.
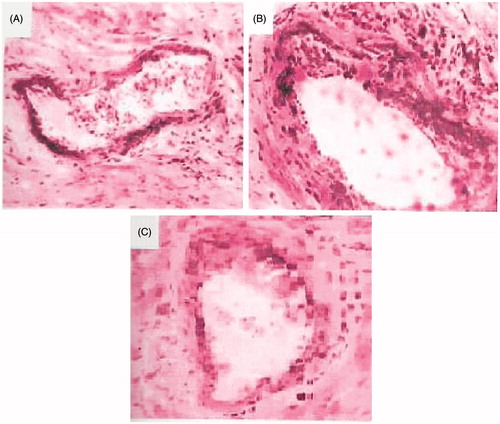
Figure 2. (A) Effect of TRF on serum creatinine in experimental atherogenic rats. Values are mean ± SD. *p < 0.01 versus control; **p < 0.01 versus atherogenic diet (AD) and (B) effect of TRF on creatinine clearance in experimental atherogenic rats. Values are mean ± SD. *p < 0.01 versus control; **p < 0.01 versus atherogenic diet (AD).
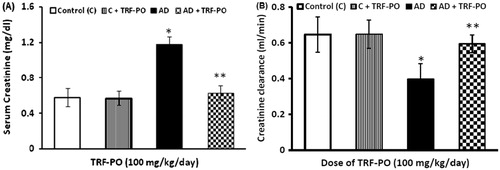
Figure 3. Effect of TRF on excretion of urinary protein in experimental atherogenic rats. Values are mean ± SD. *p < 0.01 versus control; **p < 0.01 versus atherogenic diet (AD).
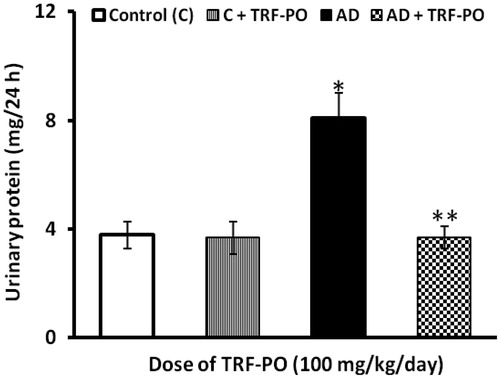
Figure 4. Effect of TRF on excretion of urinary nitric oxide in experimental atherogenic rats. Values are mean ± SD. *p < 0.01 versus control; **p < 0.01 versus atherogenic diet (AD).
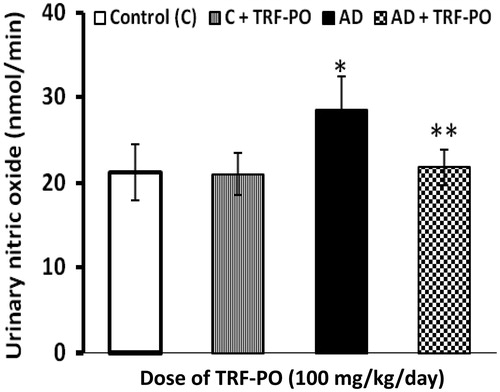
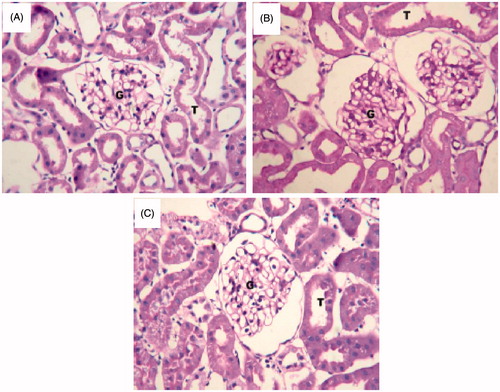
Figure 5. Histology of representative glomeruli at 40X magnification from control rats (A), rats given atherogenic diet (B) and TRF-treated rats (C). Jones PAS-stained glomeruli show expanded mesangium, widening of matrix in atherogenic experimental groups relative to control. The treatment with TRF reduced the widening of matrix and mesangial expansion as compared to untreated rats.