Figures & data
Figure 1. Effects of AT1 receptor blocker or thalidomide treatment on high glucose-induced NAG release in HK2 cells. *Denotes significant alterations at p < 0.05, when compared to control group (5.6 mM glucose) and +denotes significant alterations at p < 0.05, when compared to high glucose treatment (30 mM) group. Notes: Glu, glucose; HG, high glucose treatment (30 mM); Cand, candesartan; and Thal, thalidomide.
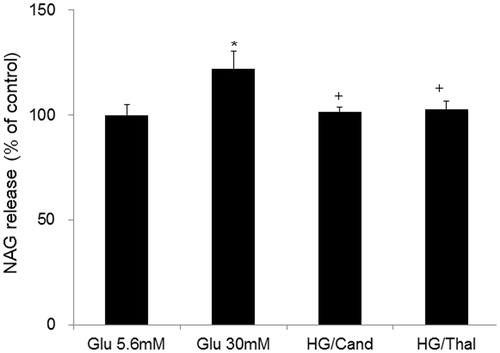
Figure 2. Effects of AT1 receptor blocker or thalidomide treatment on high glucose-induced p22phox protein levels in HK2 cells. A representative example of Western blotting was shown above. *Denotes significant alterations at p < 0.05 when compared to control group (5.6 mM glucose). +Denotes significant alterations at p < 0.05, when compared to high glucose treatment (30 mM) group. Notes: Glu, glucose; HG, high glucose treatment (30 mM); Cand, candesartan; and Thal, thalidomide.
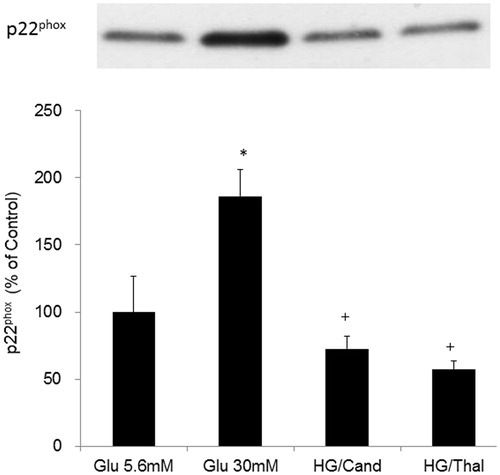
Figure 3. Effects of high glucose on TNF-α concentrations in the cell media in HK2 cells. *Denotes significant alterations at p < 0.05 when compared to control group (5.6 mM glucose) and +Denotes significant alterations at p < 0.05 when compared to high glucose treatment (30 mM) group. Notes: Glu, glucose; HG, high glucose treatment (30 mM); Cand, candesartan; and Thal, thalidomide.
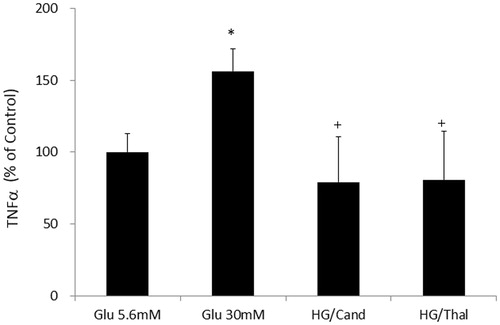
Figure 4. Effects of high glucose on angiotensin II concentrations in the cell media in HK2 cells. *Denotes significant alterations at p < 0.05 when compared to control group (5.6 mM glucose). Glu, glucose.
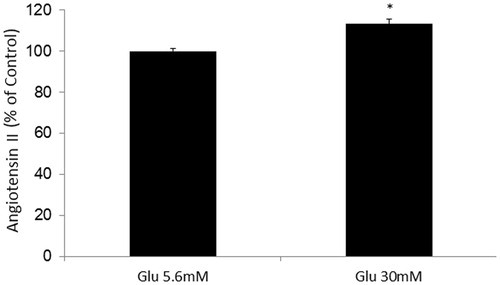
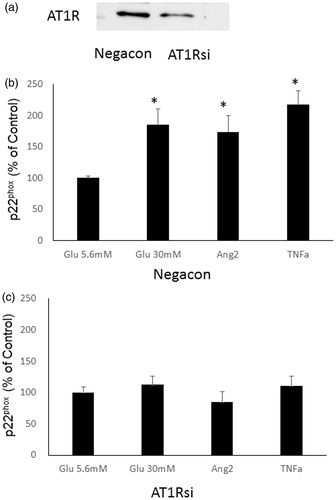
Figure 5. Effects of AT1 siRNA treatment on high glucose, angiotensin II- or TNF-α-induced p22phox protein in HK2 cells. (a) A representative example of knockdown of the AT1R protein using siRNA. Effects of glucose treatment (30 mM), angiotensin II- or TNFα-induced p22phox protein in HK2 cells with negative control siRNA (b) and with AT1 siRNA (c). *Denotes significant alterations at p < 0.05 when compared to control group (5.6 mM glucose). Glu, glucose and Ang, angiotensin.