Figures & data
Table 1. Baseline characteristics of the participants divided by dialysis status.
Table 2. Summary of laboratory parameters.
Figure 1. Box plot displaying PCS scores in patients with high and low risk for sleep apnea. Note: PCS, physical component summary.
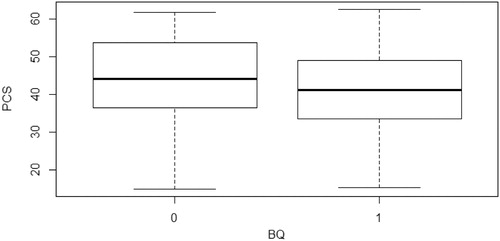
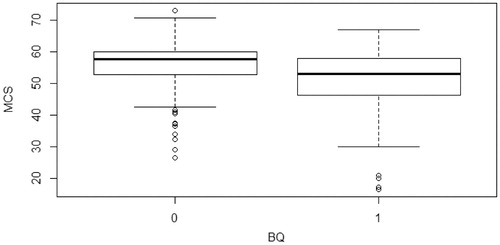
Figure 2. Box plot displaying MCS scores in patients with high and low risk for sleep apnea. Note: MCS, mental component summary.