Figures & data
Figure 1. CTGF activates canonical Wnt signaling in HK-2 cells. The cells were cultured with recombinant human CTGF (50 ng/mL) for various duration when grown to 80% confluency and serum starved for 24 h. (A) All canonical Wnt signaling pathway components were measured by western blotting. (B) Quantitative analysis of protein expression as measured by western blotting. *p < 0.05 versus control group, **p < 0.01 versus control group. All results are representative of at least three individual experiments.
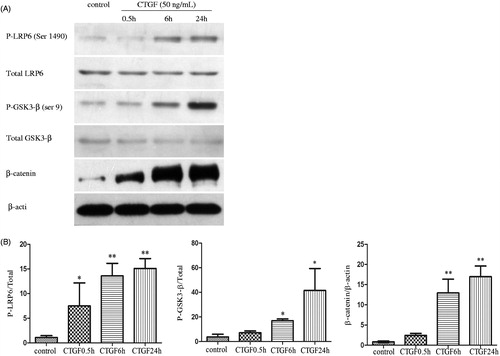
Figure 2. Effects of CTGF and Dkk-1 on β-catenin in HK-2 cells were showed by immunofluorescence staining (original magnification ×400). Left: normal control; middle: HK-2 cells were treated with CTGF (50 ng/mL) for 24 h; right: HK-2 cells were pretreated with Dkk-1 (200 ng/mL) for 1 h and then treated with CTGF (50 ng/mL) for 24 h. β-catenin expression is shown in green and cell nucleuses are shown in blue.
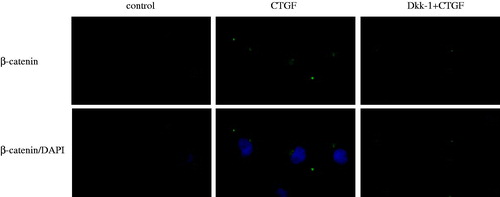
Figure 3. Dkk-1 blocked CTGF-mediated activation of canonical Wnt signaling in HK-2 cells. The cells were pretreated with various concentrations of Dkk-1 for 1 h prior to stimulation with rhCTGF (50 ng/mL). Lane 1: control group; lane 2: 50 ng/mL rhCTGF for 24 h group; lane 3: rhDkk-1 (20 ng/mL) pretreated cells prior to rhCTGF; lane 4: rhDkk-1 (200 ng/mL) pretreated cells prior to rhCTGF; lane 5: rhDkk-1 (300 ng/mL) pretreated cells prior to rhCTGF. (A) Phosphorylation of GSK3-β and protein expression of β-catenin were measured by western blotting. (B) Quantitative analysis of protein expression as measured by western blotting. **p < 0.01 versus control group, †p < 0.05 versus 50 ng/mL rhCTGF for 24 h group, ††p < 0.01 versus 50 ng/mL rhCTGF for 24 h group. All results are representative of at least three individual experiments. All results are representative of at least three individual experiments.
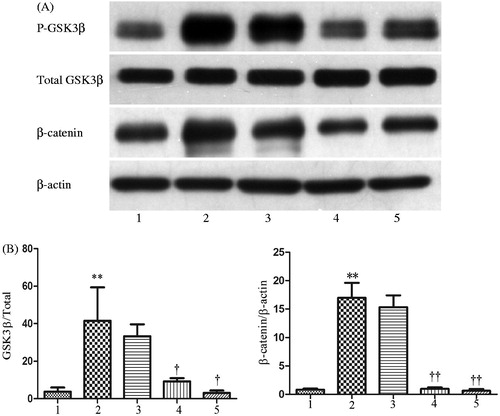
Figure 4. Morphological and phenotypic changes of HK-2 cells cultured under different conditions were determined by immunofluorescence staining under a inverted microscope. The cellular morphology (A1–A3; original magnification ×200) and the expression of α-SMA (B1–B3; original magnification ×400) and E-cadherin (C1–C3; original magnification ×400) are shown, respectively. Left: normal control and middle: HK-2 cells were treated with rhCTGF (50 ng/mL) for 24 h; right: HK-2 cells were pretreated with rhDkk-1 (200 ng/mL) for 1 h and then treated with rhCTGF (50 ng/mL) for 24 h. E-cadherin and α-SMA expression is shown in green. Cells were counterstained with 4,6-diamidino-2-phenylindole dihydrochloride hydrate (DIPA) to demonstrate the nuclei (blue).
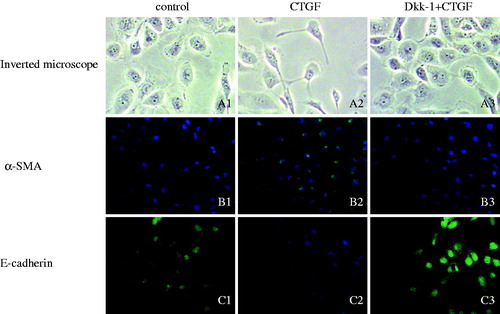
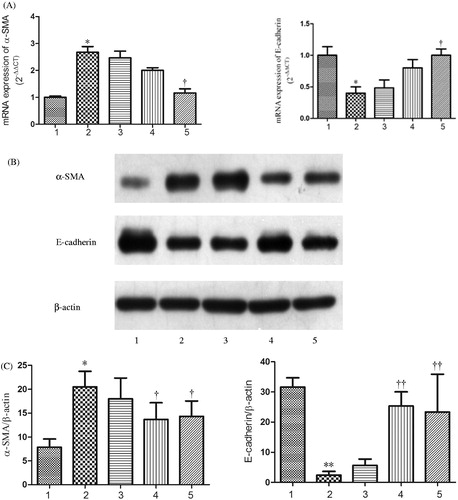
Figure 5. CTGF activates tubular EMT in HK-2 cells. The cells were cultured with rhCTGF (50 ng/mL) for various duration, when grown to 80% confluency and serum starved for 24 h. (A) The mRNA expressions of α-SMA and E-cadherin were measured by real-time PCR. (B) The protein expression of α-SMA and E-cadherin were measured by western blotting. (C) Quantitative analysis of protein expression as measured by western blotting. *p < 0.05 versus control group and **p < 0.01 versus control group. All results are representative of at least three individual experiments.
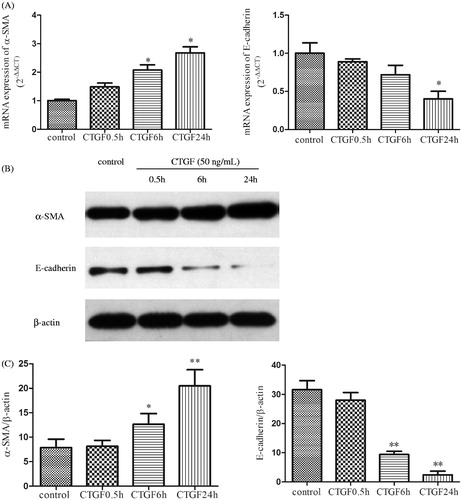
Figure 6. Dkk-1 suppressed CTGF-mediated EMT in HK-2 cells. The cells were pretreated with various concentrations of Dkk-1 for 1 h prior to stimulation with rhCTGF (50 ng/mL). Lane 1: control group; Lane 2: 50 ng/mL rhCTGF for 24 h group; Lane 3: rhDkk-1 (20 ng/mL) pretreated cells prior to rhCTGF; Lane 4: rhDkk-1 (200 ng/mL) pretreated cells prior to rhCTGF; Lane5: rhDkk-1(300 ng/mL) pretreated cells prior to rhCTGF. (A) The mRNA expressions of α-SMA and E-cadherin were measured by real-time PCR. (B) The protein expression of α-SMA and E-cadherin were measured by western blotting. (C) Quantitative analysis of protein expression as measured by western blotting. *p < 0.05 versus control group, **p < 0.01 versus control group; †p < 0.05 versus 50 ng/mL rhCTGF for 24 h group; and ††p < 0.01 versus 50 ng/mL rhCTGF for 24 h group. All results are representative of at least three individual experiments.