
Figures & data
Table 1. Comparisons of the effects of insulin-containing dermal patches on body weight, food and water intake in STZ-induced diabetic rats with control non-diabetic animals and untreated diabetic rats.
Table 2. Comparison of the effects of insulin-containing dermal patches on renal function parameters in STZ-induced diabetic rats with control non-diabetic animals and untreated diabetic rats.
Table 3. Comparisons of the effects on terminal plasma biochemical parameters of insulin-containing dermal patches in STZ-induced diabetic rats with control non-diabetic and untreated diabetic rats.
Figure 1. Comparison of mean weekly urinary glucose outputs of STZ-induced diabetic rats treated with sc insulin and PI hydrogel matrix patch (16.80 µg/kg) thrice daily at 09 h00 followed by the same dose at 17 h00 and the 8 h later (01h00) for five weeks with control non-diabetic rats and untreated STZ-induced diabetic rats. Notes: *Denotes p < 0.05 by comparison with non-diabetic control animals. #Denotes p < 0.05 by comparison with untreated STZ-induced diabetic animals.
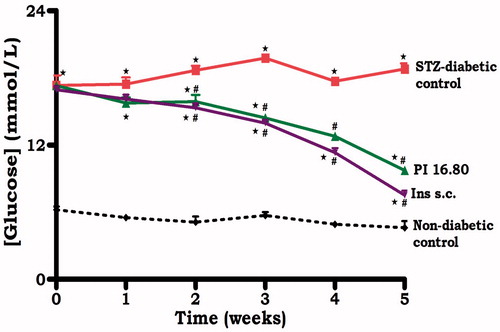
Figure 2. Comparison of the effects of topically applied PI hydrogel matrix patch and sc insulin on GLUT1 and SGLT1 in kidney tissues of STZ-induced diabetic rats, respectively, with untreated non-diabetic as determined by western blotting. Values are expressed as mean ± SEM. Values were obtained from western blots for six preparations. Notes: *Denotes p < 0.05 by comparison with non-diabetic animals. ♦Denotes p < 0.05 by comparison with respective control animals.
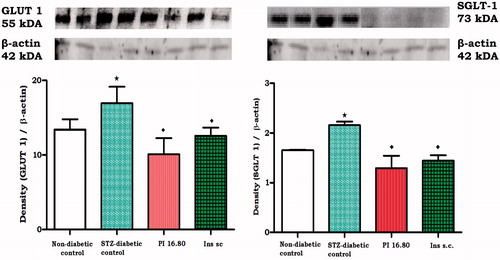
Figure 3. Photomicrographs (H and E) illustrating the effects of transdermally delivered insulin on the morphology of the kidney in STZ-induced diabetic rats. Photomicrograph (A) represents the normal glomerulus of the untreated non-diabetic rat kidney section showing normal glomerular basement membrane (GMB), glomerular capillaries (C), nuclei (N), proximal convoluted tubule (PCT), mesangium (M), veins (V) and squamous cells (S). Photomicrograph (B) represents the injured glomerulus of the STZ-diabetic rat showing irregular glomerular capillaries, thickened glomerular basement membrane (TGBM), thickened basement membrane of the Bowmans capsule (TBMBC), hypercellularity of the proximal tubules (HPT) and mesangial proliferation (MP). Photomicrograph (C) represents the glomerulus of the transdermal insulin treated rat kidney section showing irregular glomerular capillaries but no basement membrane thickening and mesangial proliferation. Photomicrograph (D) represents the glomerulus of the subcutaneous insulin treated rat kidney section showing irregular glomerular capillaries but no basement membrane thickening (Mag 35 × 100 μm).
