Figures & data
Figure 1. Frequency distribution of interleg ABI difference in study patients.
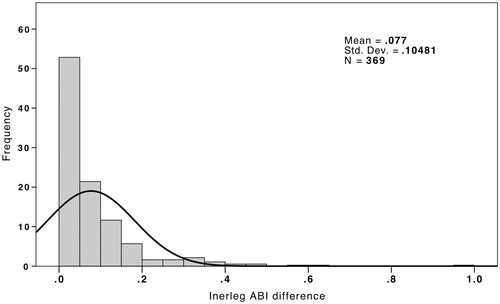
Figure 2. The Kaplan–Meier survival curves of all-cause by interleg ABI difference. The difference of survival across the four groups, including interleg difference in ABI of <0.05, 0.05–0.10, 0.10–0.15 and ≥0.15 was statistically significant with respect to all-cause mortality (χ2 = 26.36, p < 0.001) using the log-rank test.
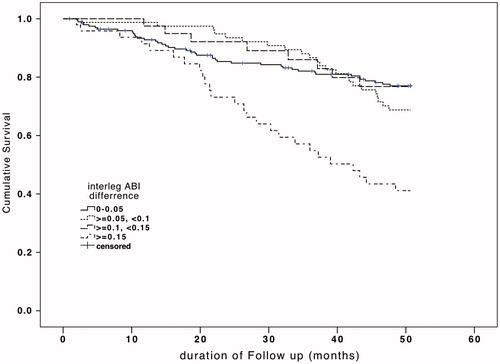
Table 1. Comparison of baseline characteristics between patients with and without an interleg difference in ABI ≥ 0.15.
Table 2. Determinants of an inter-leg difference in ABI ≥ 0.15.
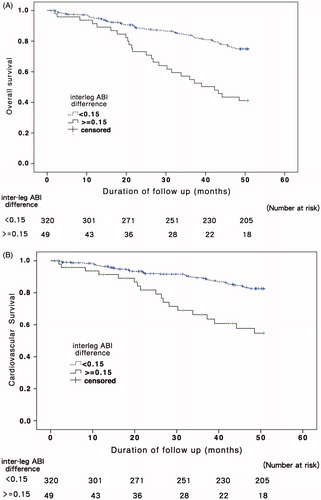
Figure 3. The Kaplan-Meier survival curves of all-cause (A) and CV mortality (B) by an interleg ABI difference of ≥0.15. The difference of survival across the two groups was statistically significant with respect to all-cause (χ2 = 25.56, p < 0.001) and CV (χ2 = 18.89, p < 0.001) mortality using the log-rank test.