Figures & data
Table 1. Treatment characteristics of patients undergoing two experimental HDHP.
Figure 1. The comparison of the RR for small water-soluble solutes between two HDHP modes. Data are depicted as % (means ± SD). There were no significant differences in RR of urea and Cr between two methods. Cr, creatinine.
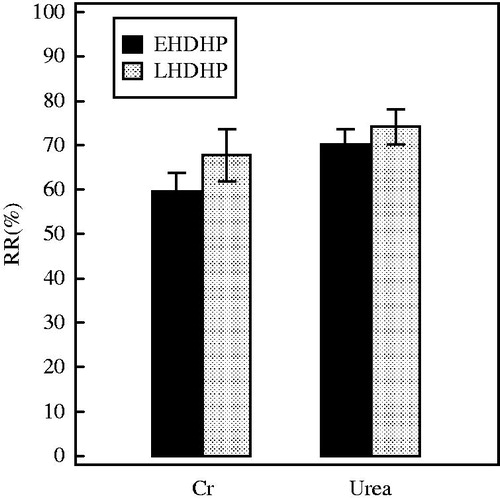
Table 2. Uremic toxins concentrations in pre-HDHP and post-HDHP specimens.
Figure 2. The comparison of the RR for middle-sized molecules between two HDHP modes. The concentrations of middle-sized molecules were corrected for hemoconcentration because of ultrafiltration, see “Materials and methods” section. Data are depicted as % (means ± SD). *p < 0.05 versus EHDHP. PTH, parathyroid hormone; β2-M, Beta 2 microglobulin.
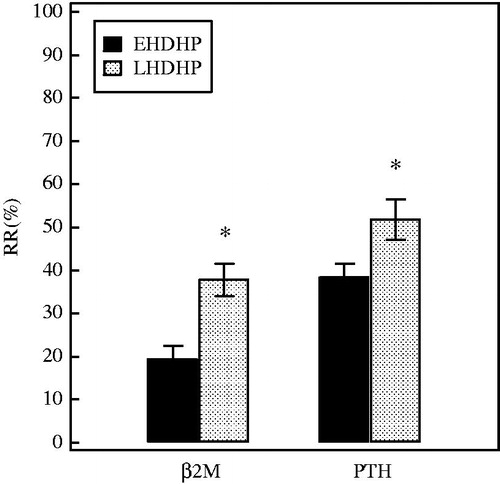
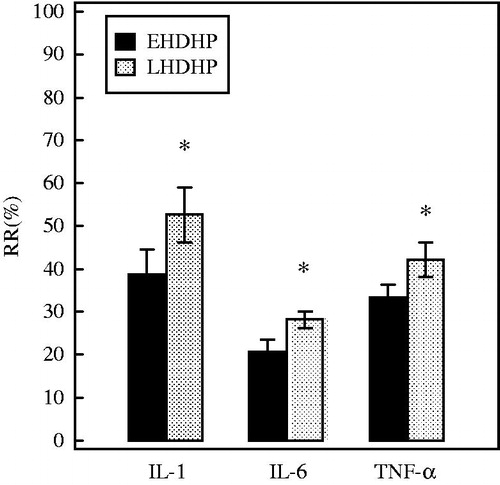
Figure 3. The comparison of the RR for cytokines between two HDHP modes. The concentrations of cytokines were corrected for hemoconcentration because of ultrafiltration, see “Materials and methods” section. Data are depicted as % (means ± SD). *p < 0.05 versus EHDHP. IL-1, interleukin-1; IL-6, interleukin-6; TNF-α, tumor necrosis factor.