Figures & data
Figure 1. Comparison between group Pr1 (normal control group), group Pr2 (ARF model group), group Pr3 (ABE 100 mg/kg/day/7day) and group Pr4 (ABE 200 mg/kg/day for 7 days) regarding kidney function tests when assessed 24 h after induction of ARF. Notes: The statistical significance between the treated groups (Pr3, Pr4), Pr1 normal control group and Pr2 model group was determined using Tukey’s test. *p < 0.001 versus Pr1 normal control group, ∞p < 0.001 versus Pr2 ARF model group. #p < 0.001 versus Pr3 ABE (100 mg/kg/day)-treated group. ABE: Açai berry extract, ARF: acute renal failure, BUN: blood urea nitrogen.
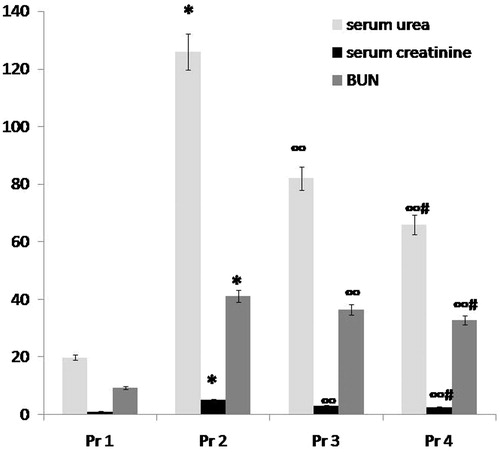
Figure 2. Comparison between group T1 (normal control group), group T2 (ARF model group), group T3 (ABE 100 mg/kg/day for 7 days) and group T4 (ABE 100 mg/kg/day for 7days) regarding kidney function tests when assessed 7 days after induction of ARF. Notes: The statistical significance between T the treated groups (T3, T4), T1 normal control group and T2 model group was determined using Tukey’s test. *p < 0.001 versus T1 normal control group, ∞p < 0.001 versus T2 ARF model group, #p < 0.001 versus T3 ABE (100 mg/kg/day)-treated group. T: treatment, ABE: Açai berry extract, ARF: acute renal failure, BUN: blood urea nitrogen.
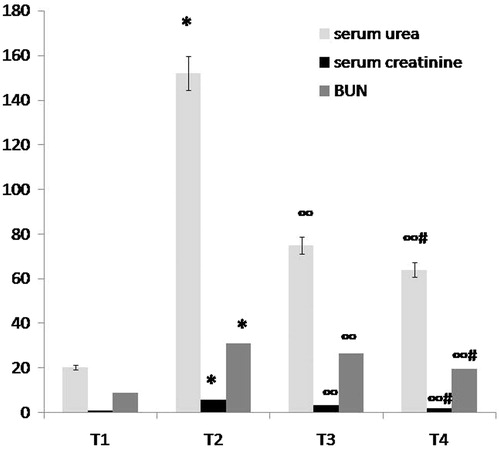
Table 1. Comparison between group Pr1 (normal control group), group Pr2 (ARF model group), group T3 (ABE 100 mg/kg/day for 7days), group Pr3 (ABE 200 mg/kg/day) and group Pr4 (ABE 200 mg/kg/day for 7days), before induction of ARF regarding kidney function tests, renal GSH and renal CAT when assessed 24 h after induction of ARF.
Table 2. Comparison between group T1 (normal control group), group T2 (ARF model group), group T3 (ABE 100 mg/kg/day for 7 days) and group T4 (ABE 200 mg/kg/day for 7 days) regarding kidney function tests, renal GSH and renal CAT when assessed 7 days after induction of ARF.
Figure 3. Comparison between group Pr1 (normal control group), group Pr2 (ARF model group), group Pr3 (ABE 100 mg/kg/day for 7 days) and group Pr4 (ABE 200 mg/kg/day for 7 days) regarding oxidative stress markers (renal GSH and renal CAT) when assessed 24 h after induction of ARF. Notes: The statistical significance between the treated groups (Pr3, Pr4), Pr1 normal control group and Pr2 model group was determined using Tukey’s test. *p < 0.001 versus Pr1 normal control group, ∞p < 0.001 versus Pr2 ARF model group, #p < 0.001 versus Pr3 ABE (100 mg/kg/day)-treated group. Pr: prophylaxis, ABE: Açai berry extract; ARF: acute renal failure; GSH: reduced glutathione.
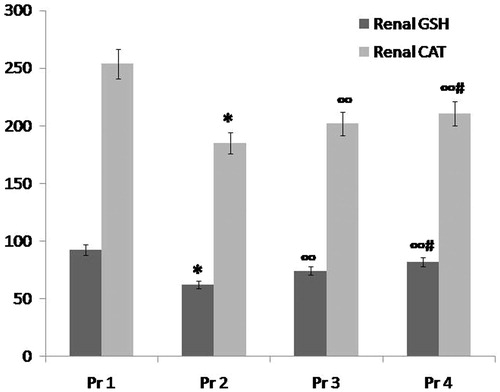
Figure 4. Comparison between group T1 (normal control group), group T2 (ARF model group), group T3 (ABE 100 mg/kg/day for 7 days) and group T4 (ABE 100 mg/kg/day for 7 days) regarding oxidative stress markers (renal GSH and renal CAT) when assessed 7 days after induction of ARF. Notes: The statistical significance between T the treated groups (T3, T4), T1 normal control group and T2 model group was determined using Tukey’s test. *p < 0.001 versus T1 normal control group, ∞p < 0.001 versus T2 ARF model group, #p < 0.001 versus T3 ABE (100 mg/kg/day)-treated group. T: treatment, ABE: Açai berry extract, ARF: acute renal failure, GSH: reduced glutathione.
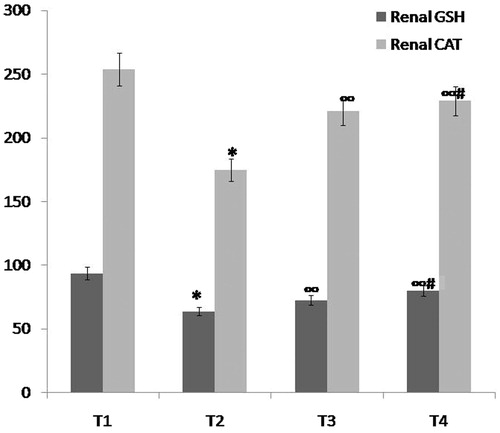
Figure 5. Histopathological changes in the prophylactic study groups. (a) Pr1: Normal control group showing a section of normal kidney (H&E staining; 400×). (b) Pr2: ARF model group showing about 50% necrotic cortical tubules with casts (H&E; 400×). (c) Pr3: ABE (100 mg/kg/day)-treated group showing less than 30% necrotic tubules with some casts (H&E; 400×). (d) Pr4: ABE (200 mg/kg/day)-treated group showing occasional necrotic tubules (H&E; 400×).
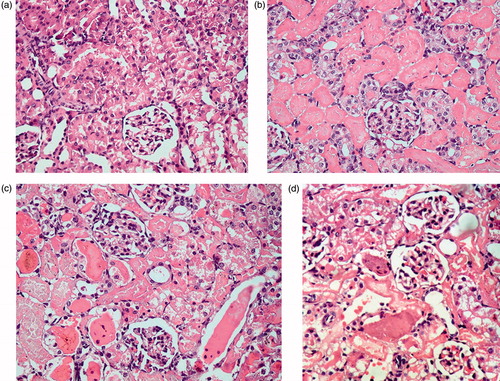
Figure 6. Comparison between group Pr2 (ARF model group), group Pr3 (ABE 100 mg/kg/day for7 days) and group Pr4 (ABE 200 mg/kg/day for 7days) regarding renal histopathological scoring when assessed 24 h after induction of ARF. Notes: The statistical significance between the Pr-treated groups (Pr3, Pr4) and Pr2 model group, was determined using Tukey’s test. ∞p < 0.001 versus Pr2 ARF model group, #p < 0.001 versus Pr3 ABE (100 mg/kg/day)-treated group. Pr: Prophylaxis, ABE: Açai berry extract, ARF: acute renal failure.
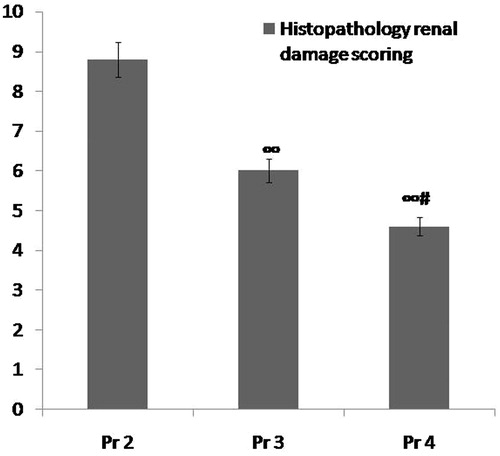
Figure 7. Histopathological changes in the therapeutic study groups. (a) T1: Normal control group showing a section of normal kidney (H&E staining; 400×). (b) T2 ARF model group showing more than 70% necrotic cortical tubules with many casts (H&E; 400×). (c) T3 ABE (100 mg/kg/day)-treated group showing about 30% necrotic tubules with casts (H&E; 400×). (d) T4 ABE (200 mg/kg/day)-treated group showing about some necrotic tubules (H&E; 400×).
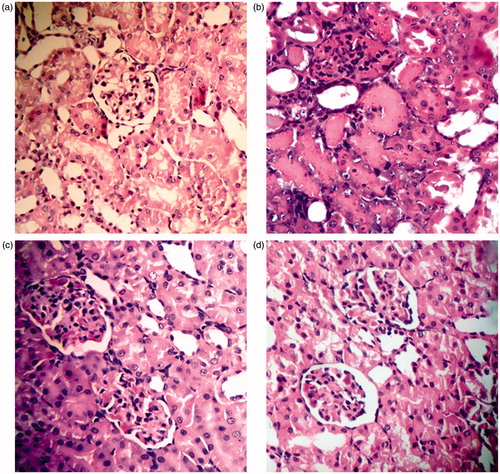
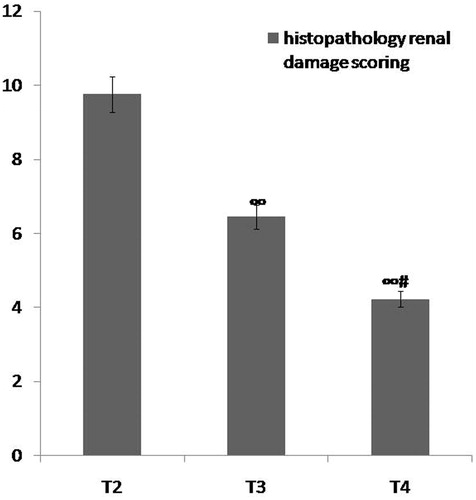
Figure 8. Comparison between group T2 (ARF model group), group T3 (ABE 100 mg/kg/day for 7 days) and group T4 (ABE 100 mg/kg/day for 7 days) regarding renal histopathological scoring when assessed 7 days after induction of ARF. Notes: The statistical significance between the treated groups (T3, T4) and T2 model group was determined using Tukey's test. ∞p < 0.001 versus T2 ARF model group, #p < 0.001 versus T3 ABE (100 mg/kg/day)-treated group. T: treatment, ABE: Açai berry extract, ARF: acute renal failure.