Figures & data
Table 1. Demographics of recipients and donors.
Table 2. HLA matches of donor and recipient.
Table 3. Condition of HLA antibody before and after kidney transplantation.
Table 4. Relationship of pre-operative HLA antibodies and DSA after kidney transplantation.
Figure 1. DSA/NDSA monitoring of kidney transplant recipients. DSA or NDSA were detected in 6 months after transplantation in 66 cases of HLA-positive recipients, 54 cases of recipients DSAmax or NDSAmax MFI fluctuated between 500 and 5000, and then in a relatively stable state; seven cases of recipients DSAmax or NDSAmax increased to 5000–10,000; 5 cases of recipients DSAmax or NDSAmax increased to more than 10,000, then fell to below 5000 after anti-rejection therapy or oral immunosuppressant drugs.
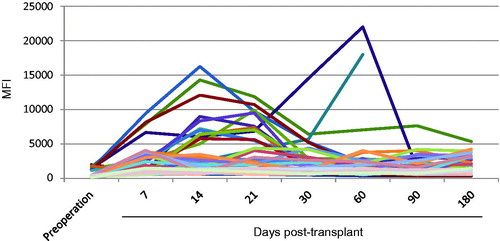
Table 5. DSA/NDSA monitoring of kidney transplant recipients.
Table 6. Relationship of HLA antibody with AR occurrences.
Figure 2. Relationship of DSA with recovery time and graft function of AR. (A) The recovery time of AR patients with DSA−/NDSA−, DSA−/NDSA+, or DSA+/NDSA+. There were significant differences between each groups. (B) The graft function after anti-rejection treatment for groups DSA−/NDSA−, DSA−/NDSA+, and DSA+/NDSA+. The differences were only found between group DSA+/NDSA+ and other two groups.
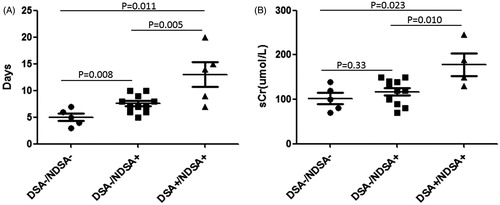
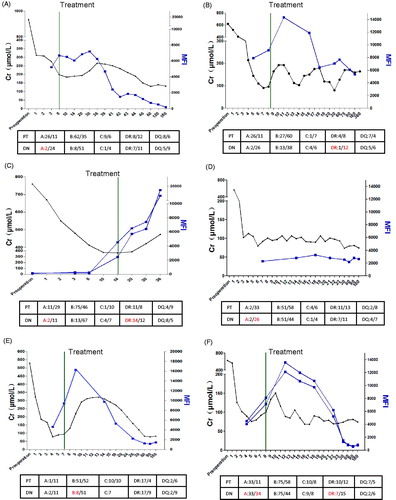
Figure 3. Relationship of DSA MFI and AR occurrence and reverse. (A–F) Case 1 to 6 with DSA-positive. Black line: the Creatinine dynamic changes of recipients post-operative. Blue line: the DSA MFI dynamic changes of recipients post-operative. Green line: The time of treatment. The below form described the HLA matching of patient (PT) and donor (DN). Red words: HLA locus which induced DSA.