Figures & data
Figure 1. Comparison of U-II levels according to fluid overload.
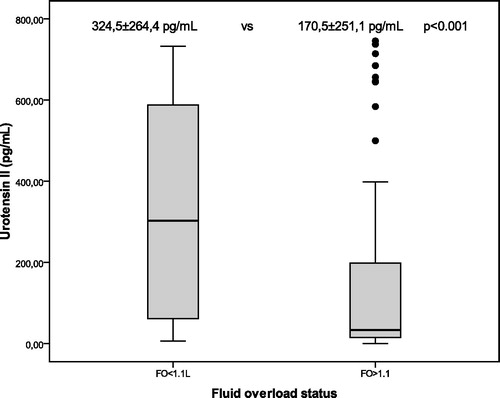
Table 1. Baseline characteristics of overhydrated and normohydrated patients.
Figure 2. Log U-II and fluid overload relation.
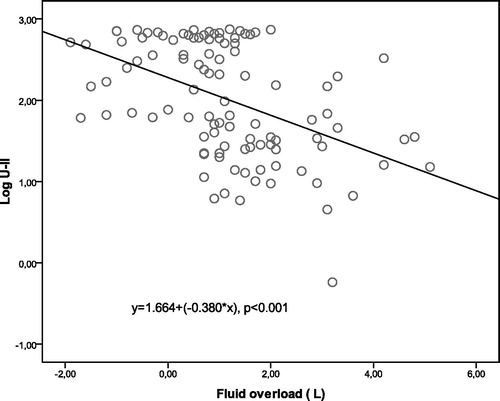
Table 2. Urotensin II and body compartments correlation analysis.
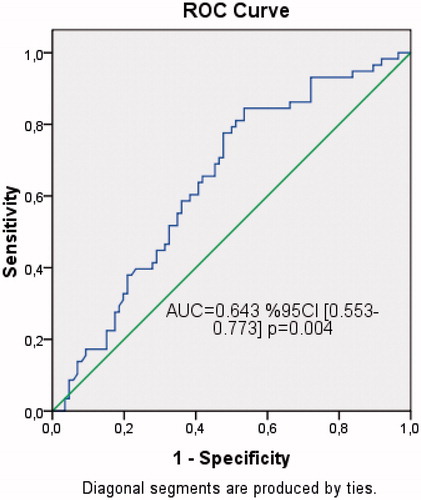
Figure 3. ROC curve of U-II for normohydration.