Figures & data
Figure 1. Anesthetic regimens and management.
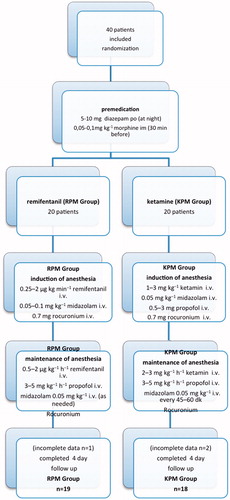
Table 1. Patient characteristics, preoperative medication, euroscore II and cardiac profile data.
Table 2. Intraoperative data, 28 day mortality.
Figure 2. Urea levels (mg dL−1) are presented as box plots for each group and time point. Note: For remifentanil group: urea 2–4 p < 0.01, urea 3–4 p < 0.05, urea 4–5 p < 0.001. For group KPM: urea 2–4 p < 0.05, urea 3–4 p < 0.05.
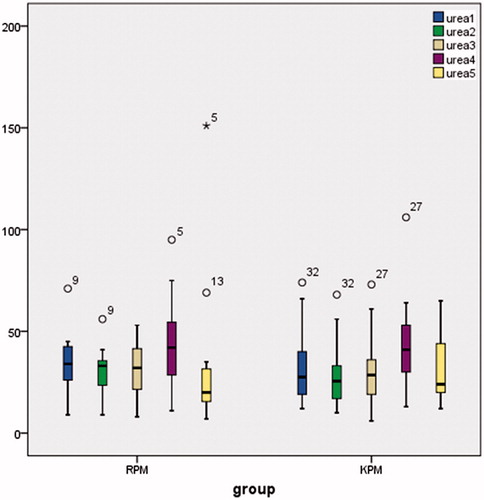
Figure 3. Creatinine levels (mg dL−1) are presented as box plots for each group and time point. Note: Both for groups Creatinine 1–4 p < 0.05, Creatinine 2–4 p < 0.001.
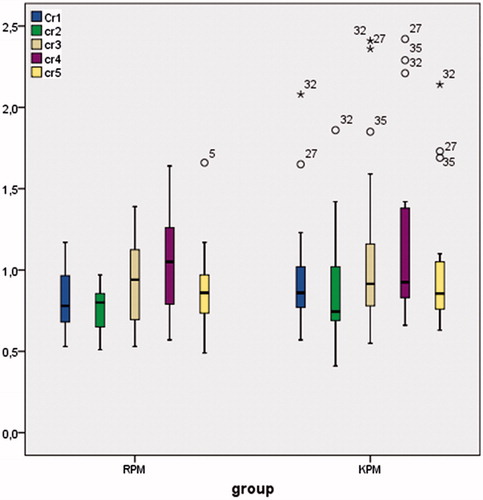
Figure 4. Cystatin-C levels (mg L−1) are presented as box plots for each group and time point. Note: For remifentanil group: Cystatin-C 1–4 p < 0.001, Cystatin-C 2–4 p < 0.001, Cystatin-C 3–4 p < 0.01. For ketamine group: Cystatin-C 1–4 p < 0.01, Cystatin-C 2–4 p < 0.001, Cystatin-C 3–4 p < 0.001, Cystatin-C 4–5 p < 0.01.
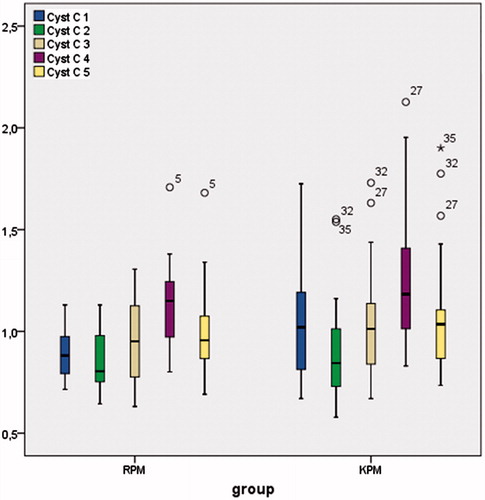
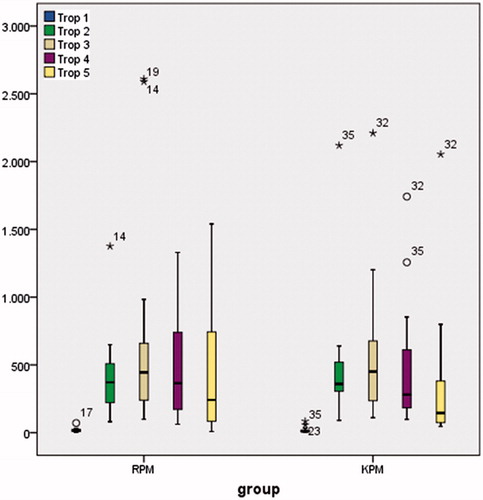
Figure 5. Hs-troponin T levels (ng/L) are presented as box plots for each group and time point. Note: Both for groups: Hs-troponin T 1–2 p < 0.001, Hs-troponin T 1–3 p < 0.001, Hs-troponin T 1–4 p < 0.001, Hs-troponin T 1–5 p < 0.05, Hs-troponin T 3–5 p < 0.001.