Figures & data
Table 1. General characteristics and demographics features of patients and donors.
Figure 1. Comparison of serum creatinine levels before and after transplantation at day 7, month 1 and month 3. Patients (n = 50) were classified to their graft functions and acute rejection episodes.
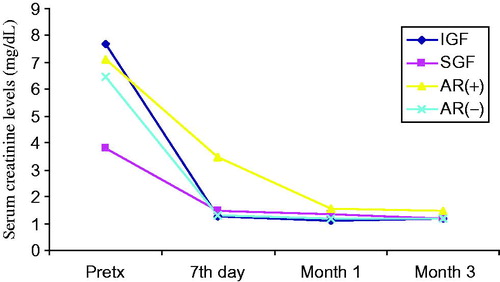
Figure 2. Comparison of serum cystatin-C levels before and after transplantation at day 7, month 1 and month 3. Patients (n = 50) were classified to their graft functions and acute rejection episodes.
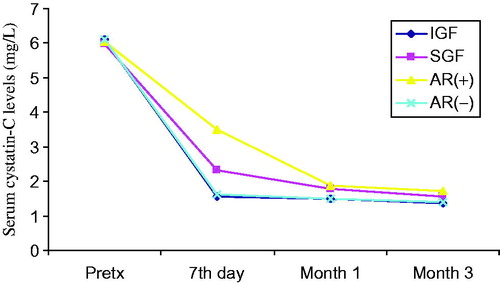
Figure 3. Comparison of serum TNF-alpha levels before and after transplantation at day 7, month 1 and month 3. Patients (n = 50) were classified to their graft functions and acute rejection episodes.
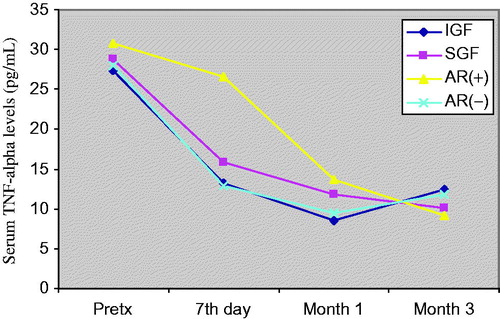
Figure 4. Comparison of serum TNFR1 levels before and after transplantation at day 7, month 1 and month 3. Patients (n = 50) were classified to their graft functions and acute rejection episodes.
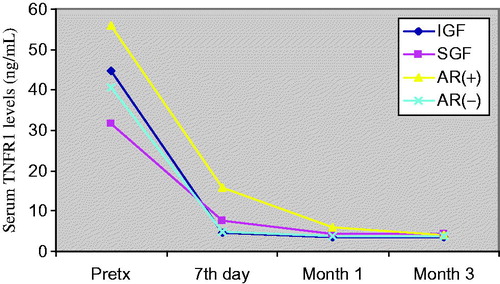
Figure 5. Comparison of serum TNFR2 levels before and after transplantation at day 7, month 1 and month 3. Patients (n = 50) were classified to their graft functions and acute rejection episodes.
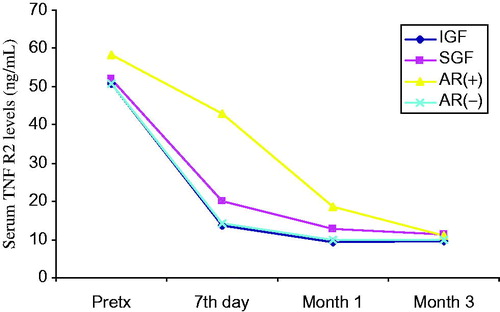
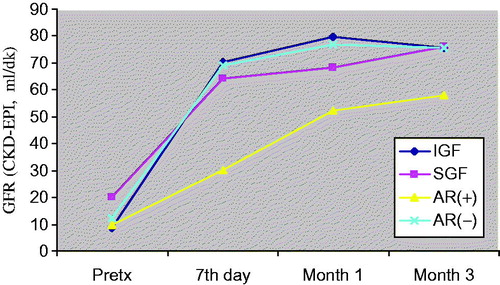
Figure 6. Comparison of eGFR values before and after transplantation at day 7, month 1 and month 3. Patients (n = 50) were classified to their graft functions and acute rejection episodes.