Figures & data
Figure 1. Effects of nesfatin-1 on renal function at 24 h after renal I/R injury. Serum creatinine (A) and blood urea nitrogen (B) concentrations were significantly higher in the saline-treated I/R group than sham group. Pretreatment with nesfatin-1 inhibited renal dysfunction after renal I/R injury. **p < 0.01 versus the sham group and #p < 0.05 versus the I/R group.
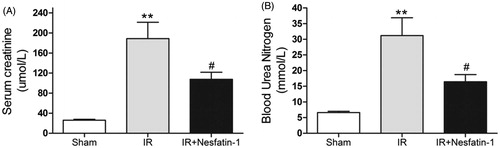
Figure 2. Effects of nesfatin-1 on histology 24 h after renal I/R injury. (A) Representative photomicrographs of hematoxylin and eosin-stained kidney sections (magnification × 200). (B) magnification × 400. (C) Histopathologic score measured at 24 h after reperfusion. **p < 0.01 versus the sham group and ##p < 0.01 versus the I/R group.
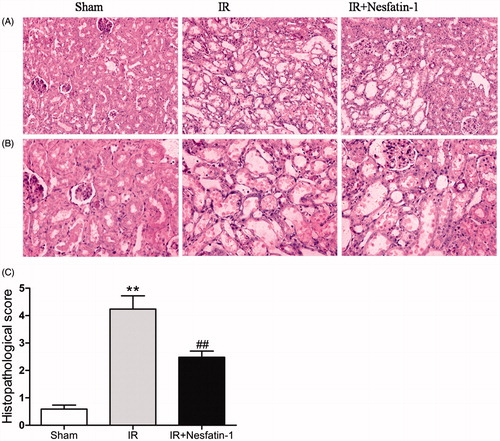
Figure 3. Effects of nesfatin-1 on renal MDA levels (A), and renal SOD (B), CAT (C) and MPO (D) activities in rats. **p < 0.01 versus the sham group and ##p < 0.01 versus the I/R group.
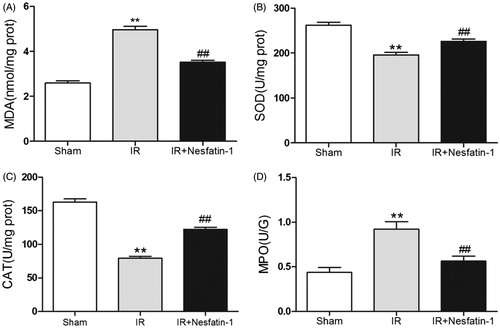
Figure 4. Effects of nesfatin-1 on I/R-induced cell apoptosis at 24 h after reperfusion by TUNEL staining. (A) Representative photomicrographs of TUNEL assay (magnification × 400). (B) Quantitative analyses of apoptotic positive cells per field. **p < 0.01 versus the sham group and #p < 0.05 versus the I/R group.
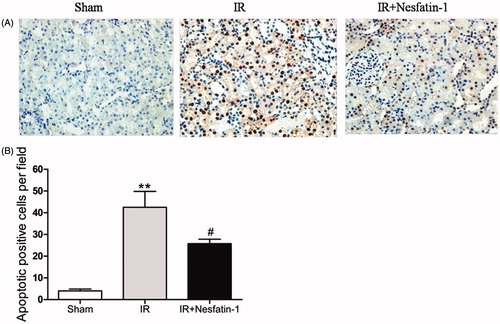
Figure 5. Effects of nesfatin-1 on I/R-induced caspase-3 expression at 24 h after reperfusion. (A) Representative photomicrographs of immunohistochemical-stained kidney sections for cleaved caspase-3 (magnification × 400). (B) Representative western blots of cleaved caspased-3. (C) Quantitative analyses of the band density of cleaved caspased-3 (relative to GAPDH). **p < 0.01 versus the sham group and ##p < 0.01 versus the I/R group.
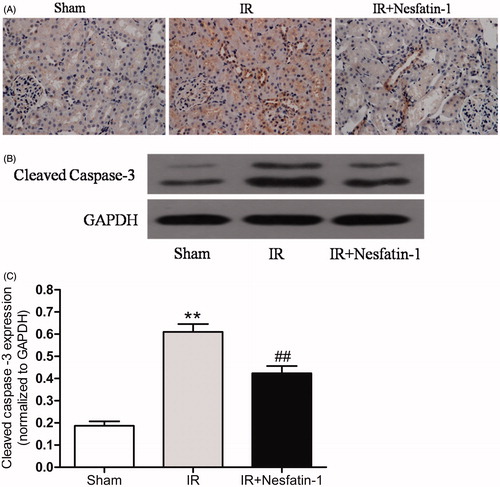
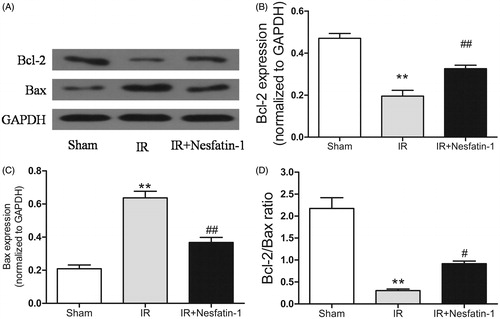
Figure 6. Effects of nesfatin-1 on Bcl-2 and Bax expression, and Bcl-2/Bax ratio at 24 h after reperfusion. (A) Representative western blots of Bcl-2 and Bax expression. (B and C) Quantitative analyses of the band density of Bcl-2 and Bax. (D) Alterations in the Bcl-2/Bax ratio. **p < 0.01 versus the sham group and #p < 0.05 versus the I/R group and ##p < 0.01 versus the I/R group.