Figures & data
Figure 1. G-Rg1 minimized UUO-triggered pathological changes in the kidneys. (A) Representative photomicrographs stained by HE (upper panels) and Masson’s trichrome (lower panels) (original magnification 200×). (B) The semi-quantitative accession of the renal interstitial lesions in HE-stained sections. (C) The degree of interstitial collagen deposits in Masson’s trichrome-stained sections. *p < 0.01 versus control group; #p < 0.01 versus model group.
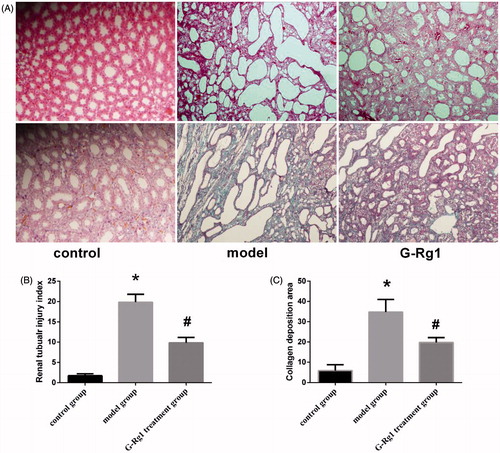
Figure 2. Cells apoptosis observed using TUNEL staining (original magnification 400×).
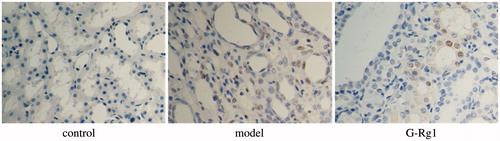
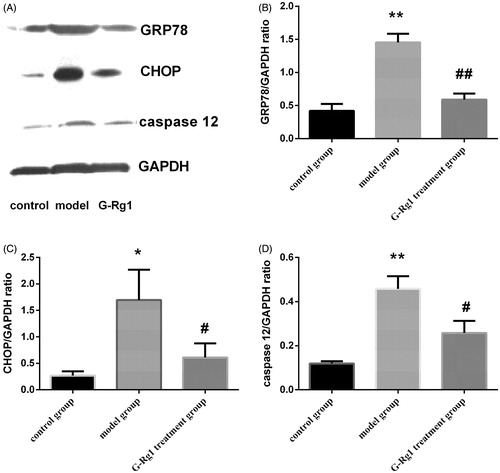
Figure 3. Effect of G-Rg1 on the expression of GRP78, CHOP and caspase 12 proteins in renal tissue. Expressions of GRP78 (78 kD), CHOP (27 kD), caspase 12 (42 kD) and GAPDH (36 kD) were determined by western blot. Respective images are shown in (A) and quantification of relative densitometries is shown in (B) (GRP78), (C) (CHOP), (D) (caspase 12), respectively. *p < 0.05, **p < 0.01 versus control group; #p < 0.05, ##p < 0.01 versus model group.