Figures & data
Table 1. Comparison of delivery and general natures of newborn pups.
Figure 1. Comparison of body weight, kidney weight and renal glomeruli number. (A) Comparison of body weight. (B) Comparison of kidney weight. (C) Comparison of the ratio of kidney weight/body weight. (D) Comparison of glomeruli number. IUGR: intrauterine growth restriction. *p < 0.05, **p < 0.01 versus control. N = 8.
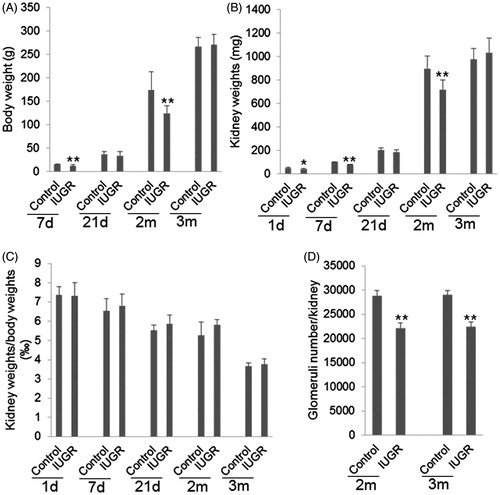
Figure 2. Correlations between kidney weights and glomerular numbers and Western blot of p53 and p53 Ser15 protein expression. Correlations between kidney weights and glomerular numbers at 2 months (A) and 3 months (B) after birth. Significant correlation between kidney weight and glomerular number of the right kidney was observed at 2 months of age (r = 0.842, p = 0.000) (A), but not at 3 months of age (r = −0.016, p = 0.953) (B). Correlation analysis included samples from two groups at the same time point. N = 16. (C) Western blot of p53 protein expression and p53 phosphorylation at serine 15. β-Actin was used as a loading control. 0, 7, 21, 60 and 90 represent at birth, 7th day, 21st day, 60th day and 90th day after birth.
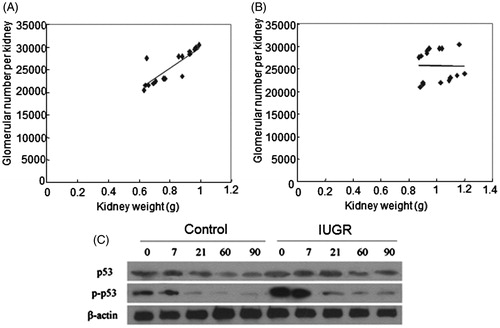
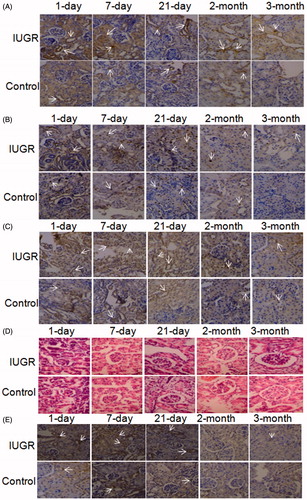
Figure 3. H&E and immunohistochemical staining. Original magnification × 400. (A) Immunotaining of p53 protein. Positive reaction was mainly localized in the cytoplasm of the renal cortex (brown staining, indicated by arrows). (B) Immunostaining of p53 Ser15 protein. Positive reaction was mainly localized in the nucleus of stromal and tubule cells in the outer cortex of the kidney (brown staining, indicated by arrows). (C) Immunostaining of p21 protein. Positive reaction was localized in the cytoplasm and nucleus of the renal cortex (brown staining, indicated by arrows). Positive p53, p53 Ser15 and p21 staining was observed in the kidney tissues of both the control and IUGR pups 1st, 7th, 21st day after birth. (D) HE staining. The glomeruli number was decreased in 2 and 3 months old IUGR pups. In contrast, the glomeruli volume was enlarged in the kidney tissues from 3 months old IUGR pups. (E) TUNEL staining. Large amount of apoptotic nucleus (brown staining, indicated by arrows) were observed in the kidney tissues of 1 day, 7 days and 21 days old pups in two groups, but few apoptotic nucleus were observed in 2 and 3 months old pups. Obviously more TUNEL positive nucleus were observed in the kidney tissues of IUGR pups compare to pups in control group at 1 day, 7 days and 21 days after birth.