Figures & data
Figure 1. Hyperglycemia can stimulate DRP1 transposition and affect mitochondrial function. (I) Western blot of total DRP1 and DRP1 in GMC mitochondria. (II) Relative quantity of DRP1 in mitochondria (*p < 0.05 when compared with group A). (III) Relative quantity of total DRP1 in GMC (*p < 0.05 when compared with group A). (IV) Relative quantity of DRP1 mRNA in mitochondria (*p < 0.05 when compared with group A). (V) Relative quantity of total DRP1 mRNA in GMC (*p < 0.05 when compared with group A). (VI) Relative quantity of ROS (*p < 0.05 when compared with group A). (VII) Relative quantity of MDA in mitochondria (*p < 0.05 when compared with group).
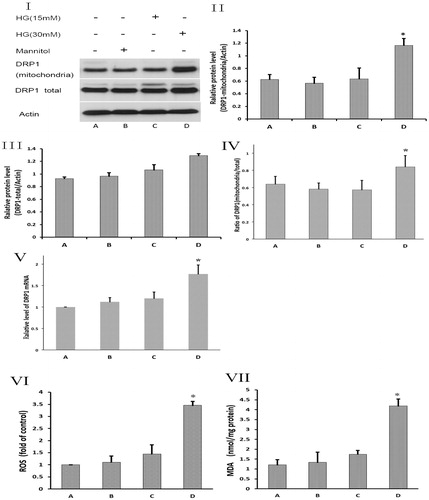
Figure 2. Midivi-1 can inhibit DRP1 transposition, reduce mitochondrial division, and improve mitochondrial function. (I) Midivi-1 inhibits the HG-produced transposition of DRP1 by Western blot. (II) Relative quantity of DRP1 in mitochondria (*p < 0.05 when compared with group A; #p < 0.05 when compared with group B). (III) Electron microscopy of mitochondrial division. Arrows: mitochondrial division. (B and C) Midivi-1 significantly suppressed the HG-induced division of mitochondria. (IV) Relative quantity of ROS expression levels (*p < 0.05 when compared with group A; #p < 0.05 when compared with group B). (V) Relative quantity of MDA production by mitochondria (*p < 0.05 when compared with group A; #p < 0.05 when compared with group B).
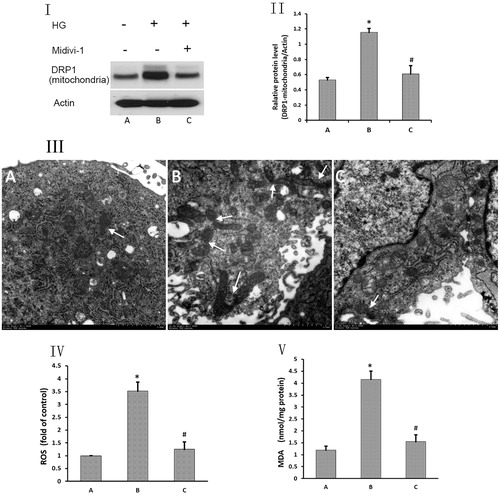
Figure 3. HG can stimulate p38 phosphorylation. Midivi-1 can reduce the production of ROS and suppress p38 phosphorylation by inhibiting DRP1 transposition. (I) Protein expression of phospho-p38 and p38 in GMC (Western blot). (II) Ratio of p-p38/p38 (*p < 0.05 when compared with group A). (III) Ratio of p-p38/p38 with intervention by NAG and Midivi-1 (group A: HG; group B: intervention with NAG; group C: intervention with Midivi-1). (IV) Relative quantity of phosphor-38 expression levels (*p < 0.05 when compared with group A).
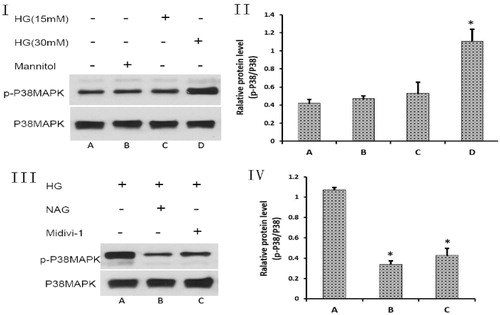
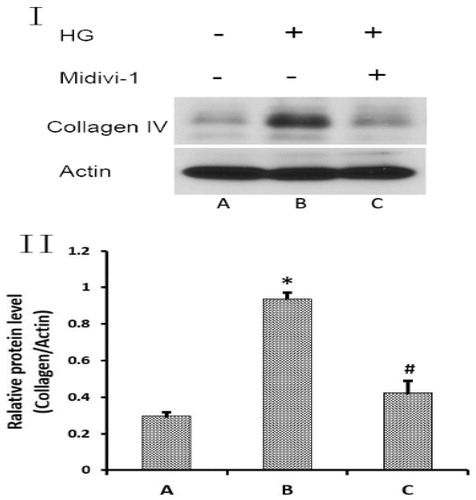
Figure 4. Intervention of Midivi 1 can reduce the expression of collagen 4. (I) Protein expression of collagen IV (Western blot). (II) Relative protein level of collagen IV (*p < 0.05 when compared with group A; #p < 0.05 when compared with group B).