Figures & data
Table 1. Characteristics of patients included into the study.
Figure 1. Comparison of mean serum chemerin concentration in patients with CKD (CKD), patients on maintenance hemodialysis treatment: before hemodialysis session (before HD) and after hemodialysis session (after HD), patients after kidney transplantation (KT) and in healthy subjects (controls). The data is presented as mean ± SD. Statistics: controls/CKD: p < 0.001; controls/beforeHD: p < 0.001; controls/afterHD: p < 0.001; controls/KT: n.s.; CKD/beforeHD: n.s.; CKD/afterHD: p < 0.002; CKD/KT: p < 0.001; beforeHD/afterHD: p < 0.001; beforeHD/KT: p < 0.001; afterHD/KT: p < 0.001.
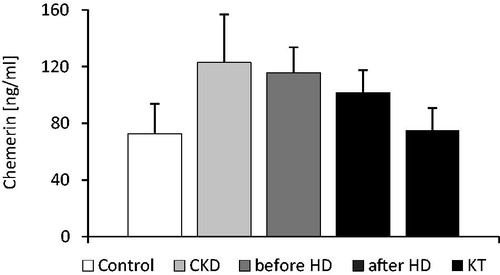
Figure 2. The scatterplot of chemerin serum concentration and eGFR determined in studied patients (control and CKD groups; n = 138).
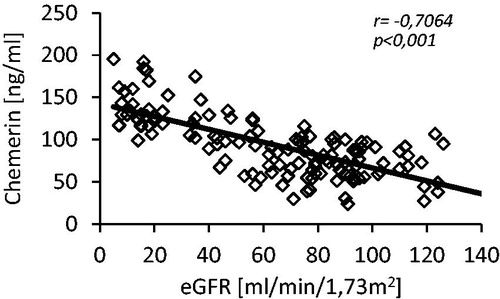
Figure 3. The comparison of (a) chemerin mRNA levels in adipose tissue and (b) serum chemerin concentration of patients with stage 3 and 4 chronic kidney disease (CKD) and controls (Controls). The received blots were scanned and quantified by Sigma Scan software program. The data are expressed in arbitrary units (a.u.).
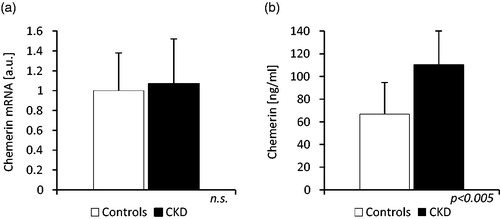
Figure 4. The relationship between plasma levels of chemerin and (a) total cholesterol (TCh), (b) LDL-cholesterol (LDL-Ch), (c) HDL-cholesterol (HDL-Ch) and (d) triglycerides (TG) determined in studied patients (control and CKD groups; n = 138).
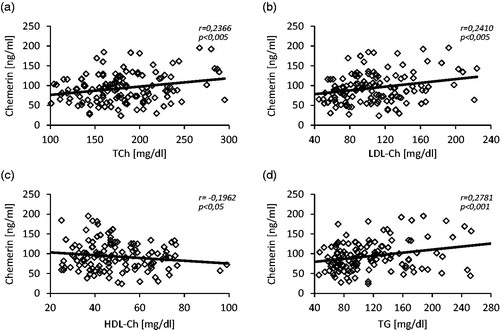
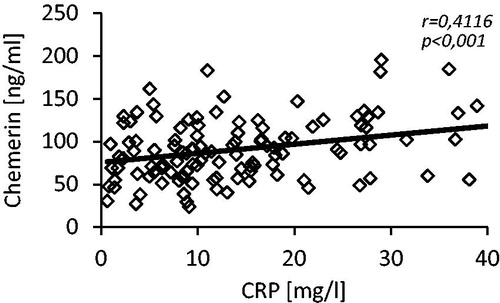
Figure 5. The scatterplot of chemerin and C-reactive protein (CRP) serum concentrations determined in studied patients (control and CKD groups; n = 138).