Figures & data
Figure 1. Data flow diagram.
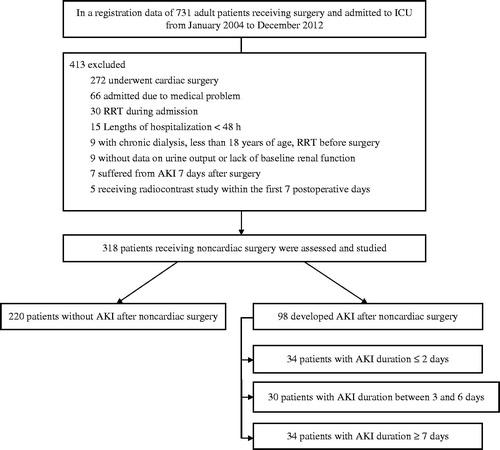
Table 1. Definition and stage for AKI, according to the KDIGO classification.
Table 2. Patients’ demographic data and clinical characteristics.
Table 3. Patients’ data divided according to KDIGO stages and subdivided by tertiles of the AKI duration.
Figure 2. Cumulative survival rate for 318 postoperative patients based on their AKI stages and the different tertiles of AKI in each of the KDIGO stages. Cumulative survival curve according to AKI stages (A) and the different tertiles of AKI in each of the KDIGO stages (B–D). The overall in-hospital survival rates were significantly in (A), (B) and (D) (p < 0.001 by log-rank test).
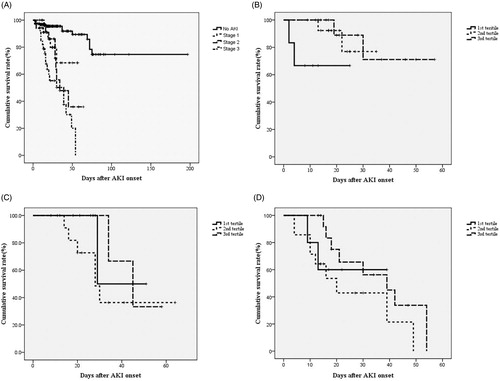
Figure 3. Cumulative survival rate for 318 postoperative patients based on the tertiles of AKI and the different AKI stages in each of the tertiles. Cumulative survival curve according to tertiles of AKI stages (A) and the different stages of AKI in each of the tertiles (B–D). *p < 0.05 by log-rank test in (A) and (C).
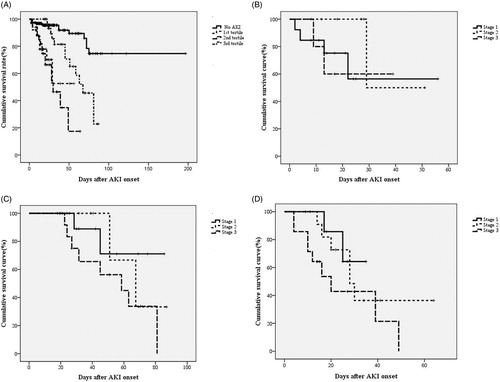
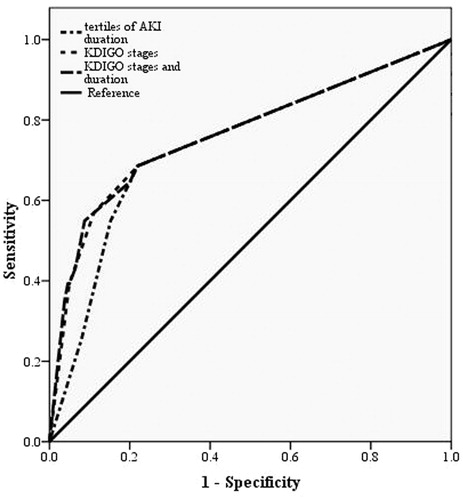
Figure 4. The AUC of the ROC curve for in-hospital mortality according to AKI stage, duration and stage together with duration.