3,150
Views
4
CrossRef citations to date
0
Altmetric
Laboratory Study

The association of serum-free light-chain levels with markers of renal function

, , , &
Pages 1057-1060 | Received 31 Jan 2015, Accepted 12 May 2015, Published online: 09 Jun 2015

Figures & data

Table 1. Patient demographic and biochemical data.

Table 2. Spearman correlation coefficients for λ sFLC, κ/λ ratio, creatinine and eGFR in Group 1 patients.

Figure 1. Serum kappa-free light-chain concentrations in Group 1 patients. Kappa sFLC increased dramatically in CKD stages (p < 0.05).
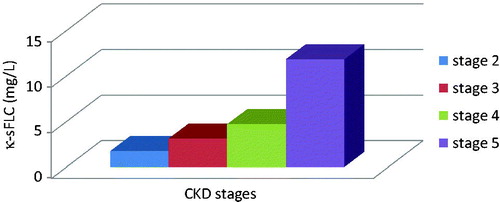
Figure 1. Serum kappa-free light-chain concentrations in Group 1 patients. Kappa sFLC increased dramatically in CKD stages (p < 0.05).

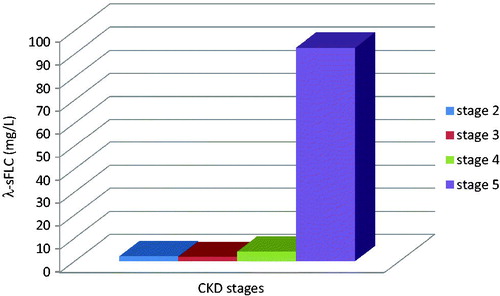
Figure 2. Serum lambda-free light-chain concentrations in Group 1 patients. Serum-free lambda light chains increased progressively with each CKD stage (p < 0.05).

Figure 2. Serum lambda-free light-chain concentrations in Group 1 patients. Serum-free lambda light chains increased progressively with each CKD stage (p < 0.05).

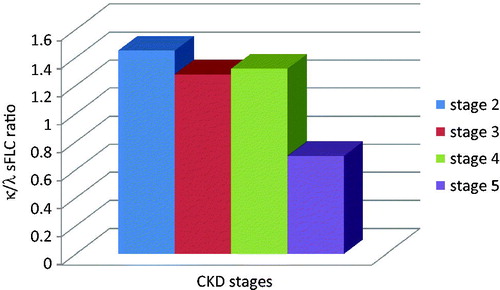
Figure 3. Serum-free kappa/lambda ratio in Group 1 patients. Serum-free kappa/lambda ratio decreased dramatically in CKD stage 5 (p < 0.05).

Figure 3. Serum-free kappa/lambda ratio in Group 1 patients. Serum-free kappa/lambda ratio decreased dramatically in CKD stage 5 (p < 0.05).

Reprints and Corporate Permissions

Please note: Selecting permissions does not provide access to the full text of the article, please see our help page How do I view content?

To request a reprint or corporate permissions for this article, please click on the relevant link below:

Academic Permissions

Please note: Selecting permissions does not provide access to the full text of the article, please see our help page How do I view content?

Obtain permissions instantly via Rightslink by clicking on the button below:

If you are unable to obtain permissions via Rightslink, please complete and submit this Permissions form. For more information, please visit our Permissions help page.