Figures & data
Figure 1. HPLC chromatogram showing the composition of SFSE-G with structures of peak (A) trigoneoside Ib (RT = 2.2 min) and peak (B) vicenin 1 (RT = 3.2 min).
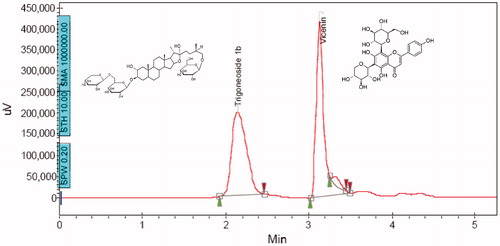
Figure 2. Concentration versus residual plot of SFSE-G.
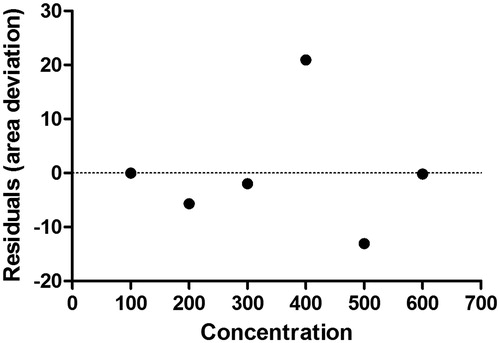
Table 1. Linear regression data for the calibration curves (n = 6).
Table 2. Intra- and inter-day precision of the HPLC method, recovery and robustness study for SFSE-G.
Figure 3. UV spectrum of SFSE-G showed the λmax at 210 nm.
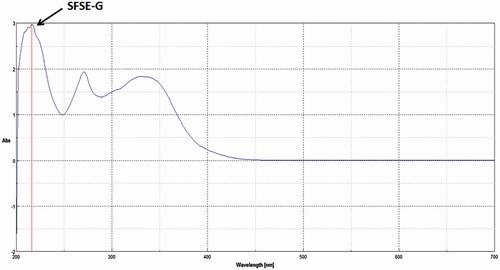
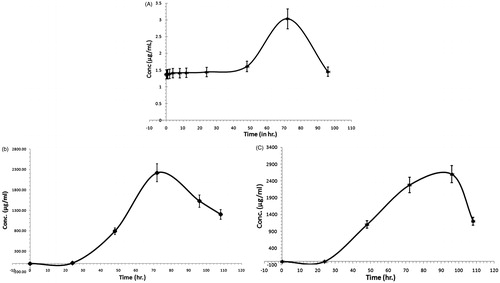
Figure 4. Representative chromatograms of blank plasma (A); plasma spiked with SFSE-G (B); plasma sample at 0 h before administration of SFSE-G (C) and plasma sample after 72 h of SFSE-G administration at a single oral dose of 200 mg/kg (D).
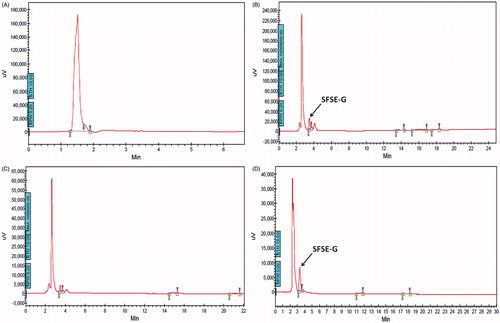
Figure 5. Representative chromatograms of blank tissue homogenate (A); lung tissue homogenate after administration of SFSE-G at a single dose of 200 mg/kg (B) and brain tissue homogenate after administration of SFSE-G at a single dose of 200 mg/kg (C).
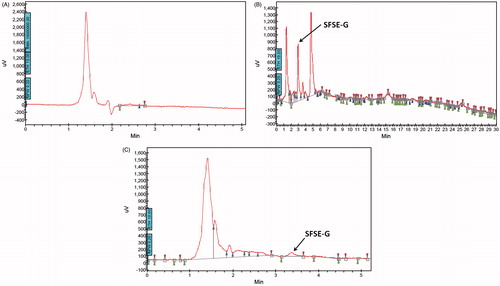
Figure 6. Mean plasma concentration–time profiles of SFSE-G in rats after receiving a single oral dose at a concentration of 200 mg/kg (A), cumulative urinary excretion of SFSE-G in rats after receiving a single oral dose at a concentration of 200 mg/kg (B) and cumulative fecal excretion of SFSE-G in rats after receiving a single oral dose at a concentration of 200 mg/kg (C).