Figures & data
Table 1. Experimental groups for the generation of gentamicin-induced AKI models.
Table 2. Forward (F) and reverse (R) primer sequences, annealing temperatures and expected product sizes.
Figure 1. H&E analysis of gentamicin-induced AKI models in SD rats showing (A) saline administered control and (B–D) AKI groups; gentamicin at (B) 100 mg/kg i.p. 6 days showing destruction of brush borders (arrow), tubular necrosis (arrow head), intraluminal cast formation (star) and disorganization of kidney architecture; (C) 100 mg/kg s.c. 4 days showing degeneration, desquamation and necrosis in tubules (arrow) and (D) 100 mg/kg i.p. 2 weeks showing tubuloepithelial changes, flattened and dilated tubules (arrows) and luminal cast (arrow head). Note: Images were taken at 20× magnification.
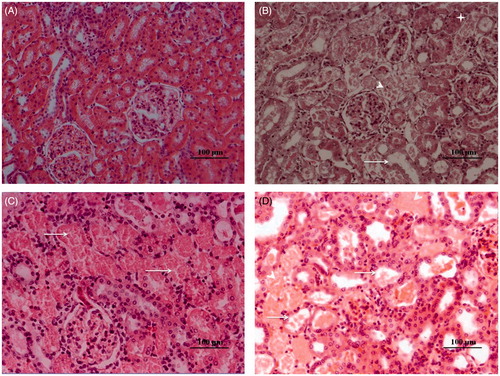
Table 3. Comparison of the histological parameters among different AKI groups.
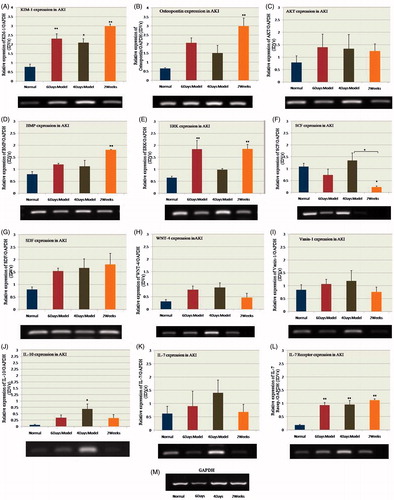
Figure 2. Gel images and bar diagrams showing quantitative densitometry analyses of (A) KIM-1, (B) osteopontin, (C) AKT, (D) BMP-7, (E) ERK, (F) SCF, (G) SDF, (H) WNT-4, (I) Vanin-1, (J) IL-10, (K) IL-7 and (L) IL-7 receptor expression in normal and injured kidneys. Y-axis shows the relative expression of each gene with respect to GAPDH expression. Notes: Expression of each gene was calculated as fold change with control value taken as 1. Data are presented as means ± standard error of means (SEM); n = 3. Differences between groups were analyzed using one-way ANOVA, followed by Tucky's post-hoc test. p Values < 0.05 were considered statistically significant.