Figures & data
Figure 1. Effect of Dex on serum renal markers in SCI-induced renal injury. (A) BUN (mg/dL) and (B) creatinine (mg/dL). Values are mean ± SD for 10 rats in each group. Comparisons are made between: (a) sham and SCI; (b) SCI and SCI + Dex. *Statistically significant (p < 0.05).
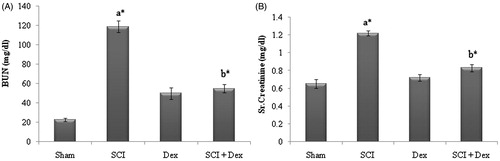
Figure 2. Effect of DEX on SCI-induced changes in LPO and protein oxidation markers in kidney tissues of rats. (A) MDA (nmol/g tissue) and (B) protein carbonyl content (nmol/mg protein). Values are mean ± SD for 10 rats in each group. Comparisons are made between: (a) sham and SCI; (b) SCI and SCI + Dex. *Statistically significant (p < 0.05).
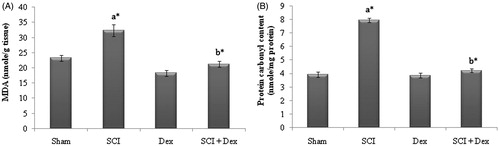
Figure 3. Effect of SCI and Dex on MPO level in kidney homogenate. The MPO was expressed as U/g of tissue. Values are mean ± SD for 10 rats in each group. Comparisons are made between (a) sham and SCI and (b) SCI and SCI + Dex. *Statistically significant (p < 0.05).
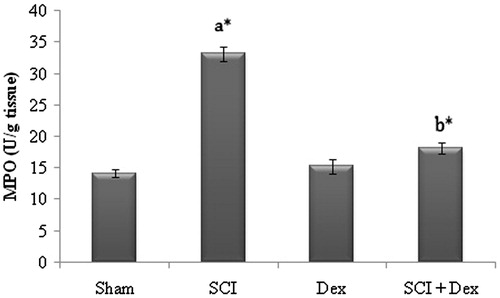
Figure 4. Effect of SCI and Dex on non-enzymic antioxidant level in kidney tissue. The GSH level was expressed µg/mg of tissue. Values are mean ± SD for 10 rats in each group. Comparisons are made between (a) sham and SCI and (b) SCI and SCI + Dex. *Statistically significant (p < 0.05).
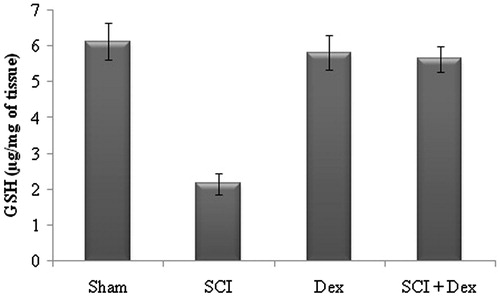
Table 1. Effect of SCI and Dex on renal enzymic antioxidant levels.
Figure 5. Levels of inflammatory cytokines in serum. (A) TNF-α (pg/mL) and (B) IL-6 (pg/mL). Values are mean ± SD for 10 rats in each group. Comparisons are made between: (a) Sham and SCI and (b) SCI and SCI + Dex. *Statistically significant (p < 0.05).
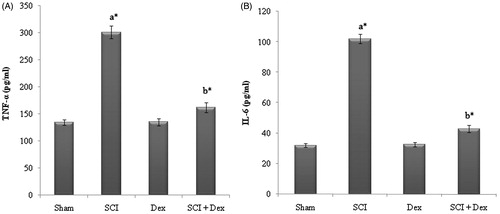
Figure 6. Western blot analysis of inflammatory cytokines in renal tissues. (A) TNF- α and IL-6 protein expression; (B) relative fold change of TNF-α and IL-6. β-Actin served as an internal control. Values are mean ± SD for five rats in each group. Comparisons are made between: (a) Sham and SCI and (b) SCI and SCI + Dex. *Statistically significant (p < 0.05).
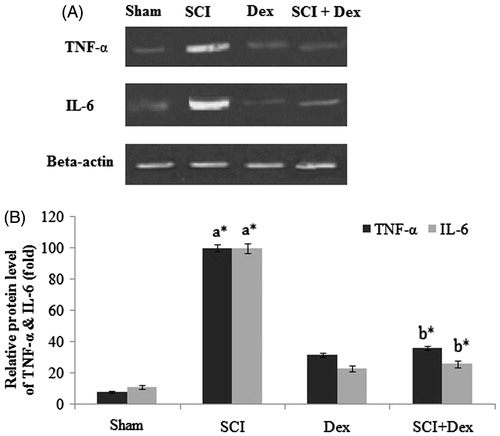
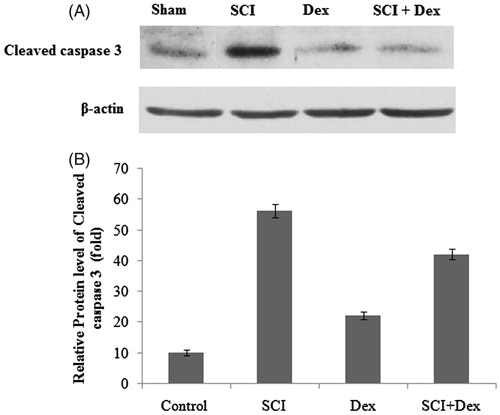
Figure 7. Western blot analysis of apoptotic marker in renal tissues. (A) Cleaved caspase 3 protein and (B) relative fold change of cleaved caspase 3. β-Actin served as an internal control. Values are mean ± SD for five rats in each group. Comparisons are made between: (a) Sham and SCI and (b) SCI and SCI + Dex. *Statistically significant (p < 0.05).