Figures & data
Figure 1. Percentage of patients with optimal ranges of CKD-MBD markers. Based on the K/DOQI clinical practice guidelines, the optimal ranges of these serum indicators were designated as 3.5–5.5 mg/dL (1.13–1.78 mmol/L) for serum inorganic phosphorus, 8.4–9.5 mg/dL (2.1–2.37 mmol/L) for serum calcium and 150–300 pg/mL for iPTH.
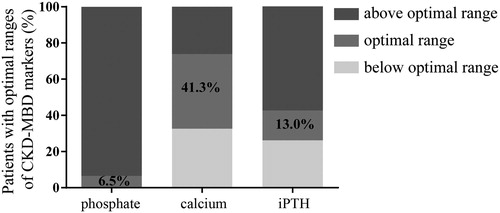
Figure 2. Inclusion flow chart.
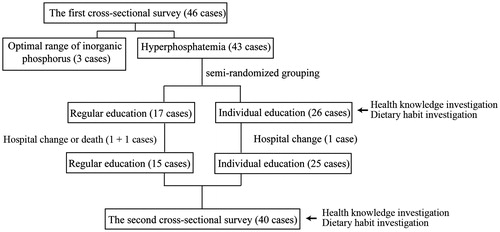
Table 1. Baseline information of the patients in the two groups before health education.
Figure 3. Awareness rate of hyperphosphatemia and dietary habits pre- and post-health education. (a) (1) iPTH, (2) MBD, (3) phosphate binder use, (4) phosphate-rich diet, (5) egg yolk is phosphate-rich and (6) phosphorus removal from meat after boiling in water. (b) (1) less/no meat soup, (2) meat intake control, (3) less/no milk, (4) less/no soybeans, (5) eating egg removal of yolk and (6) meat intake after water boiling.
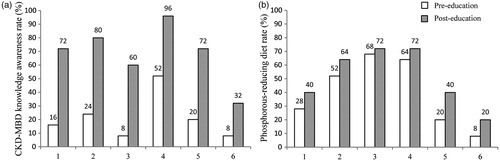
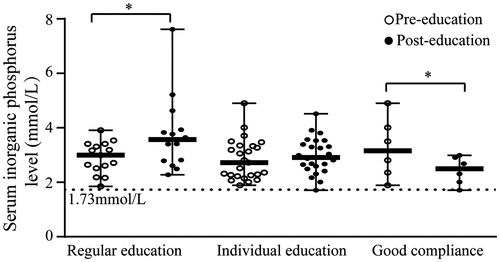
Figure 4. Comparison of serum inorganic phosphorus levels between pre- and post-health education. Error bars indicate the median and range, and circles and dots indicate the serum inorganic phosphorus level pre- and post-health education. *Significant difference between pre- and post-education (p < 0.05).