Figures & data
Table 1. Primer sequences for KIM-1, Caspase-3, TGF-β, TNF-α and β-actin.
Table 2. Effect of naringin on sodium arsenite-induced alteration in body weight, kidney weight and liver weight.
Table 3. Effect of naringin on sodium arsenite-induced alteration in kidney and liver function test.
Table 4. Effect of naringin on sodium arsenite-induced alteration in oxido-nitrosative stress and membrane-bound enzyme.
Figure 1. Effect of naringin on sodium arsenite-induced alteration in renal mRNA expression of KIM-1, Caspase-3, TGF-β and TNF-α in rats (A), quantitative representation of mRNA expression of KIM-1 (B), Caspase-3 (C), TGF-β (D) and TNF-α (E). Results are represented as mean ± SEM, (n = 4) Data was analyzed by One-way ANOVA followed by post hoc Dunnett’s tests. *p < 0.05, **p < 0.01 and ***p < 0.001 as compared with the Arsenic Control group. ###p < 0.001 as compared to normal group. N: Normal group; As: Arsenic Control group; CoQ10 (10): Coenzyme Q10 (10 mg/kg, p.o.) treated group; N (20): naringin (20 mg/kg, p.o.) treated group; N (40): naringin (40 mg/kg, p.o.) treated group and N (80): naringin (80 mg/kg, p.o.) treated group.
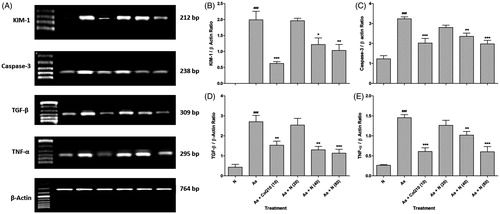
Figure 2. Effect of naringin on sodium arsenite-induced alteration in kidney histology of rats. Photomicrograph of sections of kidney from normal group (A); Arsenic Control group (B); Coenzyme Q10 (10 mg/kg, p.o.) treated group (C); Naringin (20 mg/kg, p.o.) treated group (D); Naringin (40 mg/kg, p.o.) treated group (E) and Naringin (80 mg/kg, p.o.) treated group (F). H & E staining at 100× and respective inset at 400×.
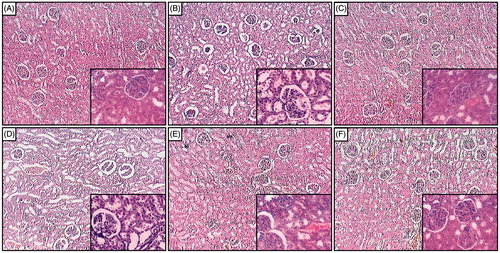
Figure 3. Effect of naringin on sodium arsenite-induced alteration in kidney histology of rats. Photomicrograph of sections of kidney from normal group (A); Arsenic Control group (B); Coenzyme Q10 (10 mg/kg, p.o.) treated group (C); Naringin (20 mg/kg, p.o.) treated group (D); Naringin (40 mg/kg, p.o.) treated group (E) and Naringin (80 mg/kg, p.o.) treated group (F). MT staining at 100×.
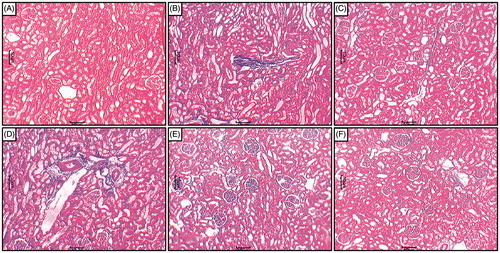
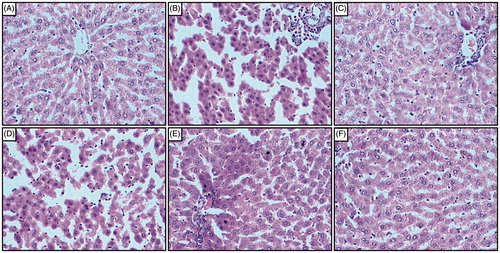
Figure 4. Effect of naringin on sodium arsenite-induced alteration in liver histology of rats. Photomicrograph of sections of liver from normal group (A); Arsenic Control group (B); Coenzyme Q10 (10 mg/kg, p.o.) treated group (C); Naringin (20 mg/kg, p.o.) treated group (D); Naringin (40 mg/kg, p.o.) treated group (E) and Naringin (80 mg/kg, p.o.) treated group (F). H & E staining at 100×.