1,760
Views
17
CrossRef citations to date
0
Altmetric
Clinical Study

Groningen frailty indicator in older patients with end-stage renal disease

, , , , &
Pages 1419-1424 | Received 26 Feb 2015, Accepted 24 Jul 2015, Published online: 31 Aug 2015

Figures & data

Table 1. Patient characteristics at baseline (n = 63).

Figure 1. Identification of geriatric impairments by the GFI and the nephrologist (n = 13).

Figure 1. Identification of geriatric impairments by the GFI and the nephrologist (n = 13).

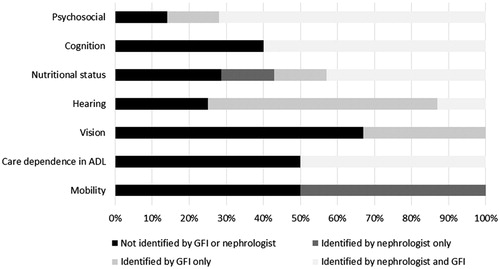
Table 2. Treatment choices.

Figure 2. Kaplan–Meier survival curves, measured from the date of inclusion until 1 year of follow-up [n = 63, n (died) = 10].

Figure 2. Kaplan–Meier survival curves, measured from the date of inclusion until 1 year of follow-up [n = 63, n (died) = 10].

Table 3. Outcomes after a year of follow-up, measured from the date of inclusion (date of GFI) (n = 63).

Supplemental material

Supplemental Files

Download Zip (17.1 KB)

Reprints and Corporate Permissions

Please note: Selecting permissions does not provide access to the full text of the article, please see our help page How do I view content?

To request a reprint or corporate permissions for this article, please click on the relevant link below:

Academic Permissions

Please note: Selecting permissions does not provide access to the full text of the article, please see our help page How do I view content?

Obtain permissions instantly via Rightslink by clicking on the button below:

If you are unable to obtain permissions via Rightslink, please complete and submit this Permissions form. For more information, please visit our Permissions help page.