Figures & data
Figure 1. A flow diagram of the research design of our study.
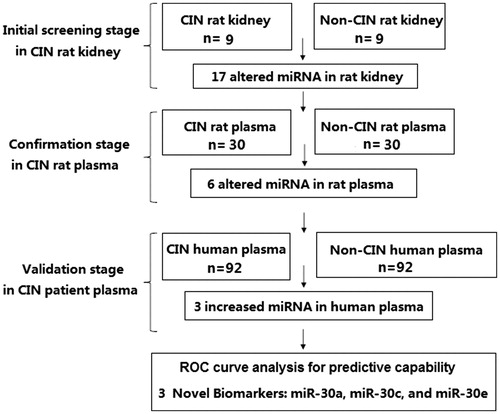
Figure 2. Altered miRNAs expression in kidney tissue of CIN rats. Fold changes were observed in kidney tissue of CIN rats compared with control rats according to the validation result of quantitative real-time PCR.
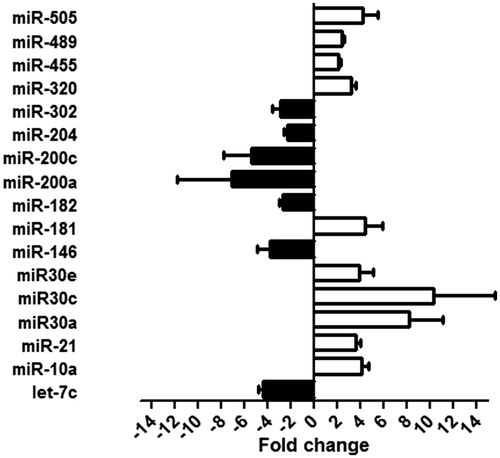
Figure 3. Altered miRNAs in plasma of CIN rats. (A) miRNA expression changes in plasma of CIN rats compared with control rats, measured by RT-qPCR analyses. (B–E) Time-course of miR-30a (B), miR-30c (C), miR-30e (D), and miR-320(E) in plasma of CIN and non-CIN rats. *p < 0.05; **p < 0.01, compared with non-CIN rats.
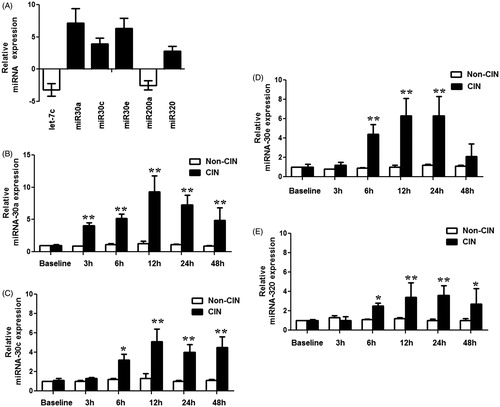
Figure 4. Dynamic changes in the SCr and eGFR values in study patients. Samples of fasting blood were collected from patients prior to and at 3, 6, 12, 24, and 48 h after their coronary artery procedure. Renal function was monitored by measuring SCr (A) and eGFR (B) in study patients. *p < 0.05, compared with patients without CIN.
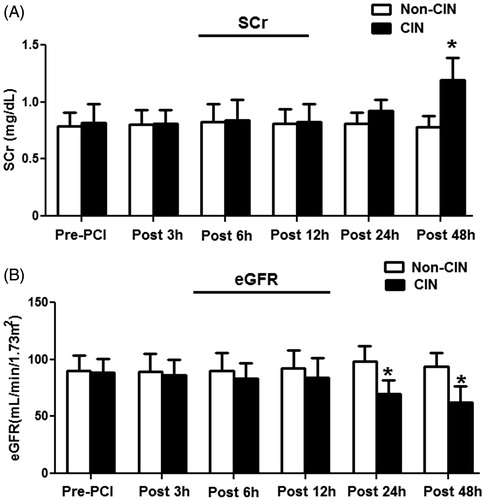
Table 1. Basal characteristics of study patients.
Figure 5. Validating the results of candidate miRNAs screened from the CIN rats in patients with and without CIN. (A) The levels of plasma miR-30a, miR-30c, miR-30e, and miR-320 in CIN patients relative to non-CIN patients assessed by RT-qPCR analyses. Plasma miR-30a, miR-30c, and miR-30e were significantly higher levels in CIN patients compared with non-CIN patients within 6 h after procedures. However, miR-320 was not significantly altered in the CIN patients compared to non-CIN patients. *p < 0.05; **p < 0.01, compared with non-CIN patients. (B–D) Peak concentration of the miR-30a (B), miR-30c (C), and miR-30e (D) in plasma of individual CIN patients compared with non-CIN patients.
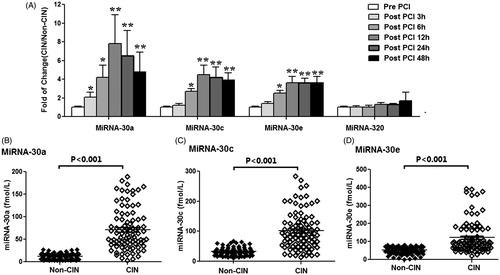
Figure 6. The correlation between the miR-30 family members (miR-30a, miR-30c, and miR-30e) in study patients. Positive correlation was observed between (A) miR-30a peak level and miR-30c peak level (Rho = 0.767, p < 0.001), (B) miR-30a peak level and miR-30e peak level (Rho = 0.681, p < 0.001), and (C) miR-30c peak level and miR-30e peak level (Rho = 0.715, p < 0.001).
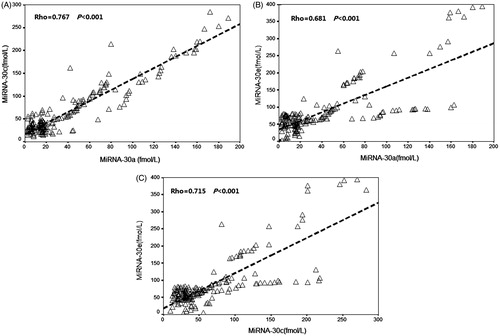
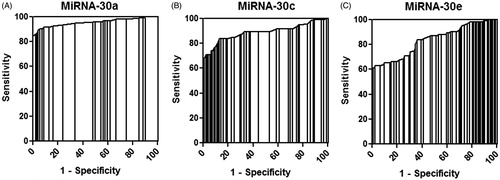
Figure 7. ROC curve analysis of miR-30a, miR-30c, and miR-30e. ROC curve analysis for (A) miR-30a, (B) miR-30c, and (C) miR-30e indicated that these miRNAs could distinguish CIN patients from non-CIN patients with high sensitivity and specificity.