Figures & data
Table 1. Effect of naringin treatment on body weight, relative liver weight, relative spleen weight, albumin, blood urea nitrogen, serum creatinine and uric acid in APAP-induced toxicity in rats.
Table 2. Effect of naringin treatment on alkaline phosphatase, total bilirubin, direct bilirubin, AST and ALT in APAP-induced toxicity in rats.
Table 3. Effect of naringin treatment on cholesterol, HDL, LDL, LDH and triglyceride in APAP-induced toxicity in rats.
Figure 1. Effect of naringin treatment on hepatic and renal SOD (A), GSH (B), MDA (C) and NO (D) in APAP-induced toxicity in rats. Data are expressed as mean ± SEM (n = 6) and analyzed by one-way ANOVA followed by Tukey’s multiple range test for each parameter separately. *p < 0.05 as compared to APAP group, #p < 0.05 as compared to normal group and $p < 0.05 as compared to one another group. APAP: acetaminophen; N (20): naringin (20 mg/kg) treated; N (40): naringin (40 mg/kg) treated; N (80): naringin (80 mg/kg) treated; SOD: superoxide dismutase; GSH: glutathione; MDA: malondialdehyde; NO: nitric oxide.
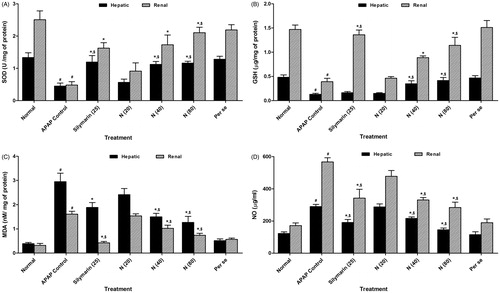
Figure 2. Effect of naringin treatment on liver FXR mRNA expression (A), renal KIM-1 mRNA expression (B) in APAP-induced toxicity in rats. Data are expressed as mean ± SEM (n = 6) and analyzed by one-way ANOVA followed by Tukey’s multiple range test for each parameter separately. *p < 0.05 as compared to APAP group, #p < 0.05 as compared to normal group and $p < 0.05 as compared to one another group. APAP: acetaminophen; FXR: farnesoid X receptor; KIM-1: kidney injury molecule-1.
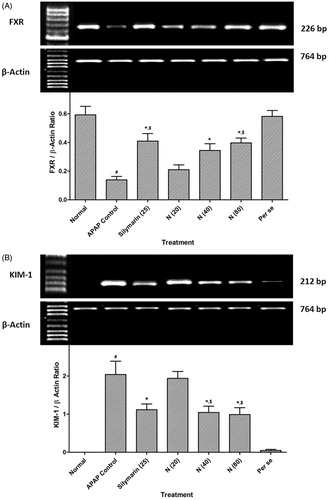
Figure 3. Effect of naringin treatment on APAP-induced pathological alteration in rat liver. Photomicrograph of sections of liver of normal (A), APAP controls (B), silymarin (25 mg/kg) treated (C), naringin (40 mg/kg) treated (D), naringin (80 mg/kg) treated (E) and per se treated (F) rats. Inflammatory infiltration (black arrow), edema (yellow arrow), congestion (green arrow) and necrosis (red arrow). H&E staining at 40× and 100 × (inset).
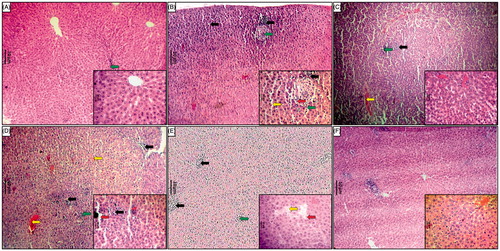
Table 4. Effect of naringin treatment on APAP-induced pathological alteration in rat hepatic and renal histology.
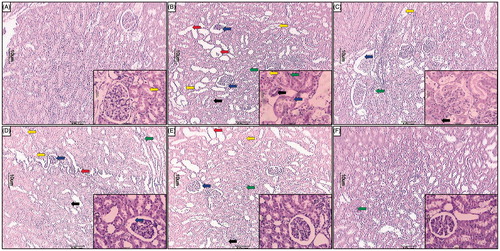
Figure 4. Effect of naringin treatment on APAP-induced pathological alteration in rat kidney. Photomicrograph of sections of kidney of normal (A), APAP controls (B), silymarin (25 mg/kg) treated (C), naringin (40 mg/kg) treated (D), naringin (80 mg/kg) treated (E) and per se treated (F) rats. Glomerular hypertrophy (blue arrow), inflammatory infiltration (black arrow), edema (yellow arrow), congestion (green arrow) and necrosis (red arrow). H&E staining at 40× and 100× (inset).